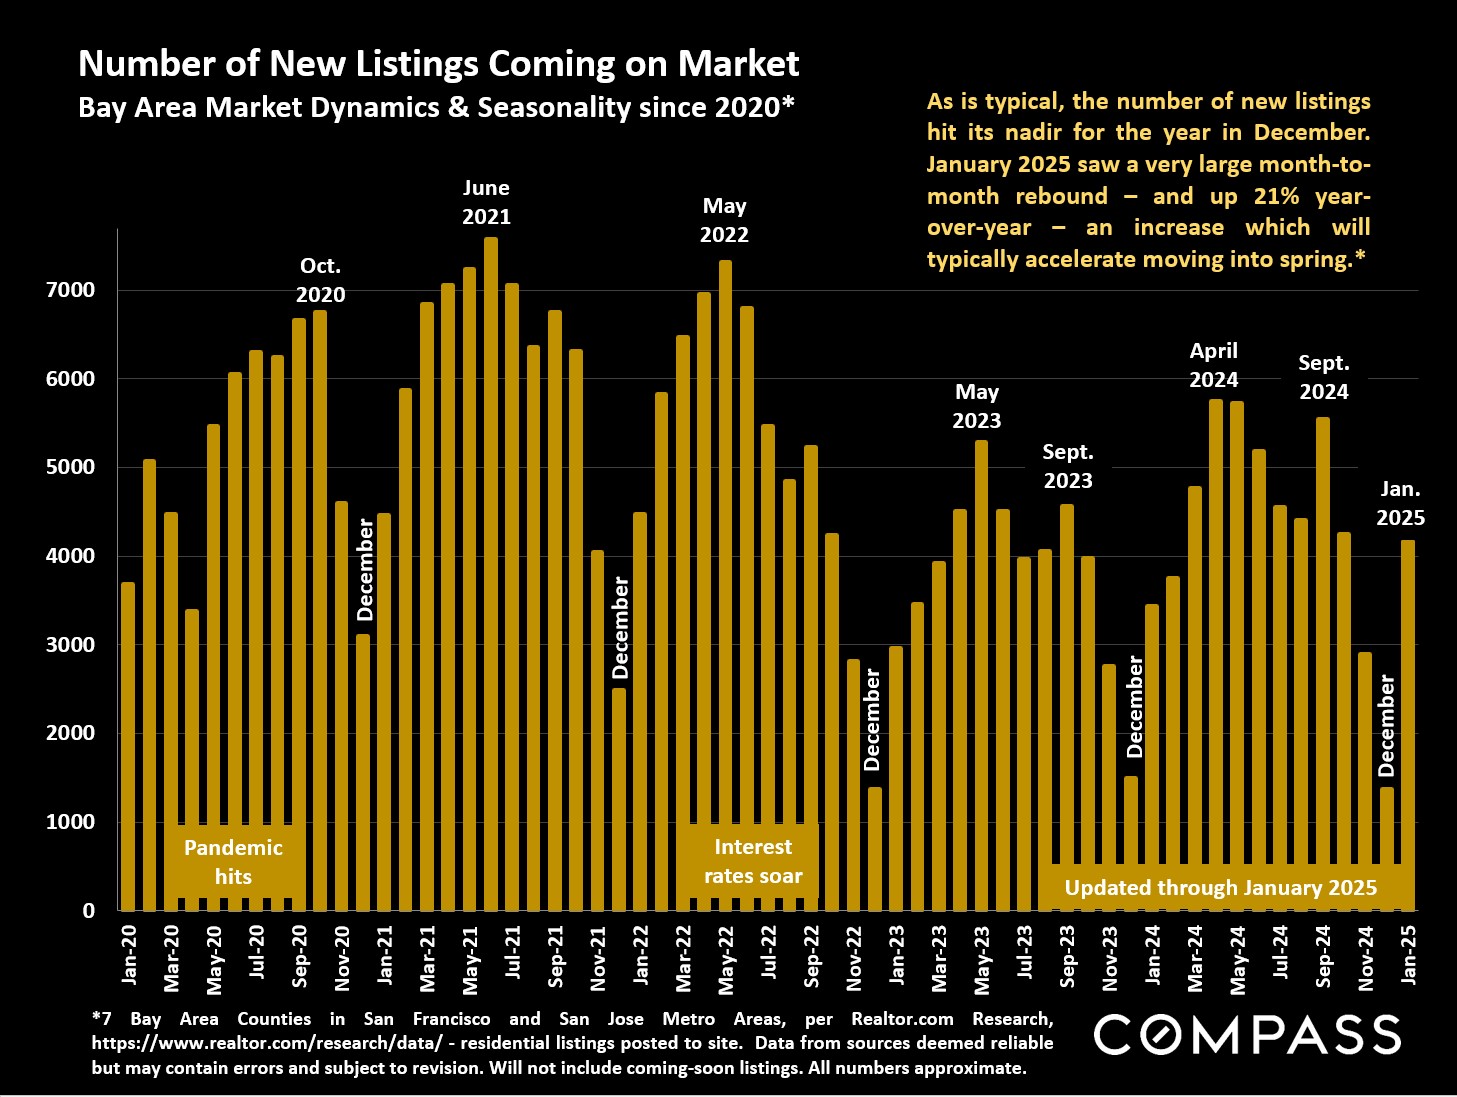
Initial calculations regarding January's Bay Area new-listings numbers reflect a huge rebound from December (as is typical) and a large jump over January 2024.
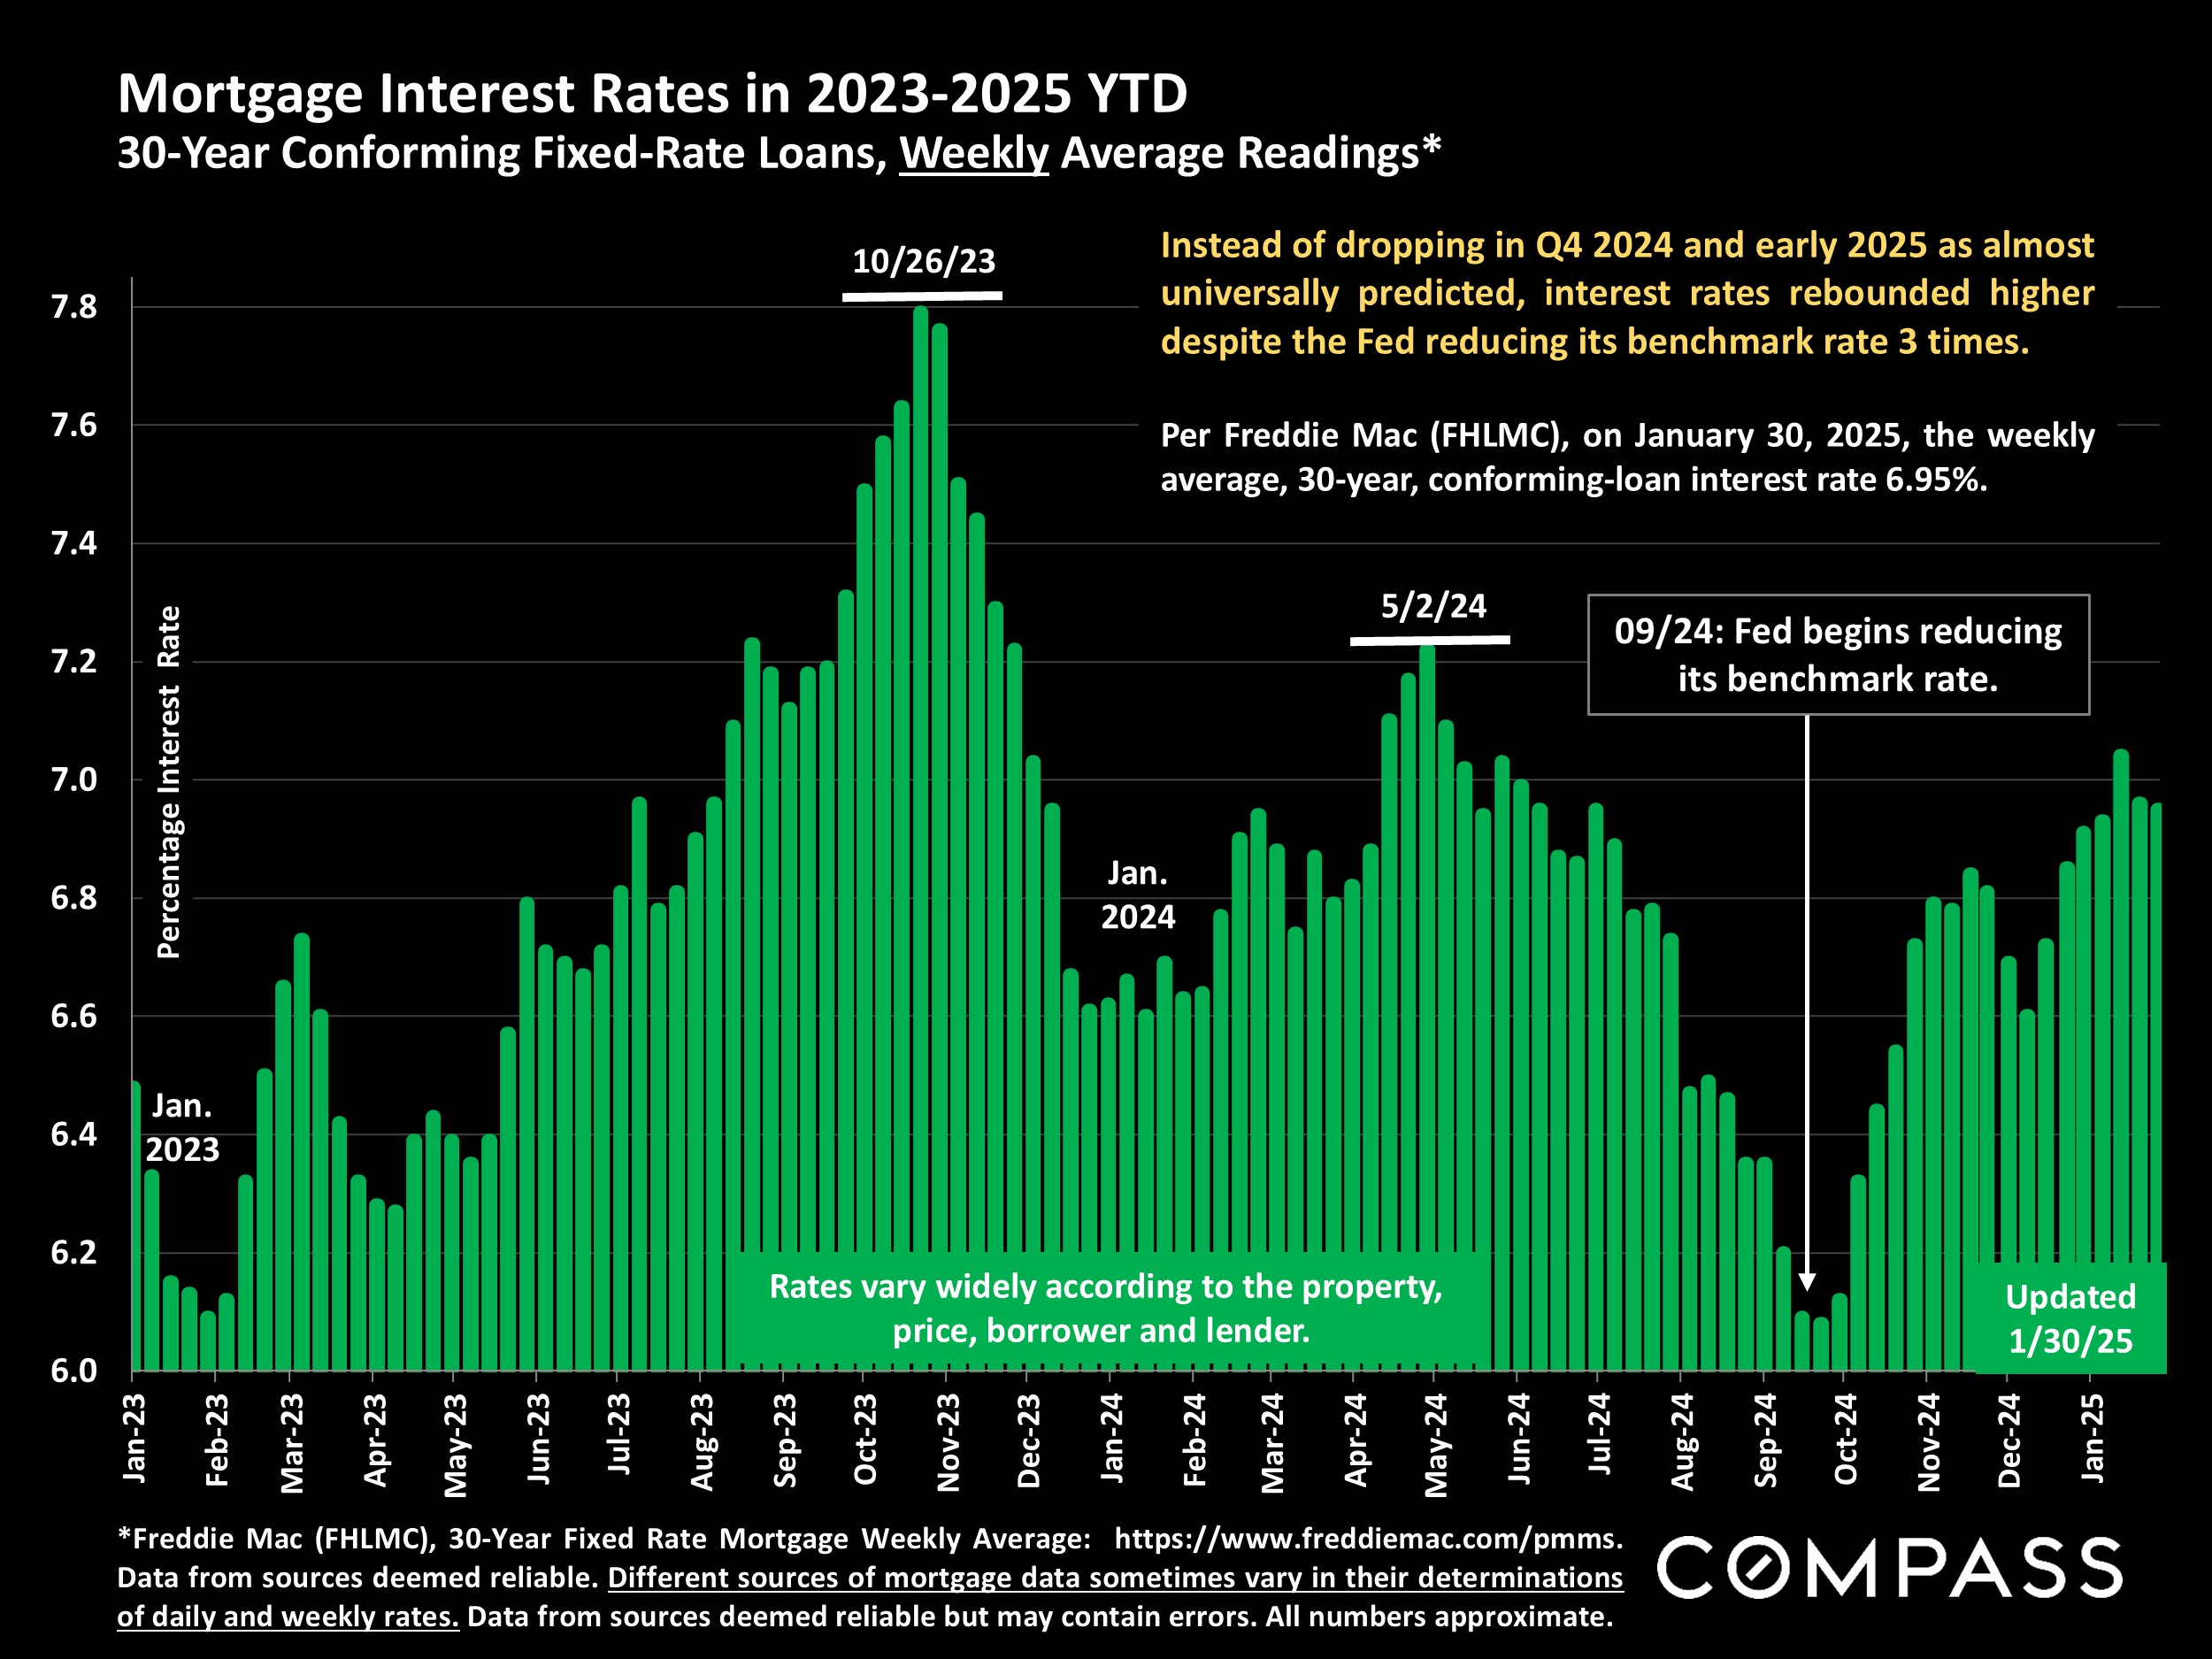
Weekly average interest rate: relatively steady at just under 7%
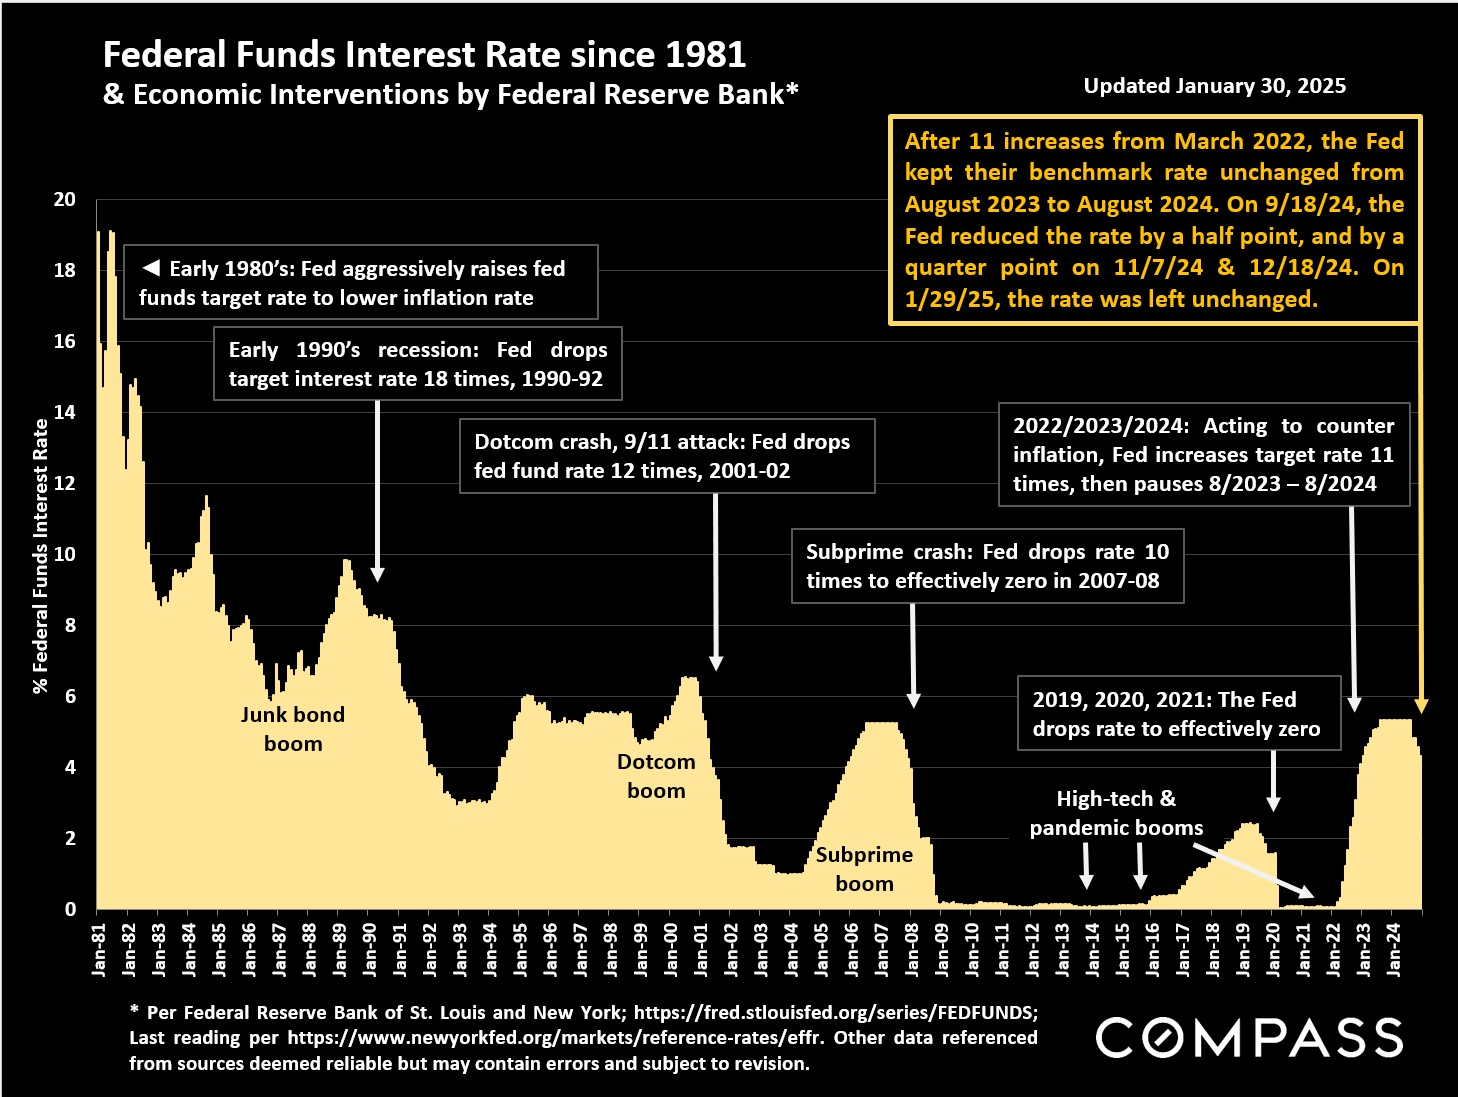
The Fed left its benchmark rate unchanged at its 1/29/25 meeting. Expect to see a struggle between the new administration and the Fed regarding the benchmark rate in the coming months. The next CPI (inflation) reading comes out on 2/12.
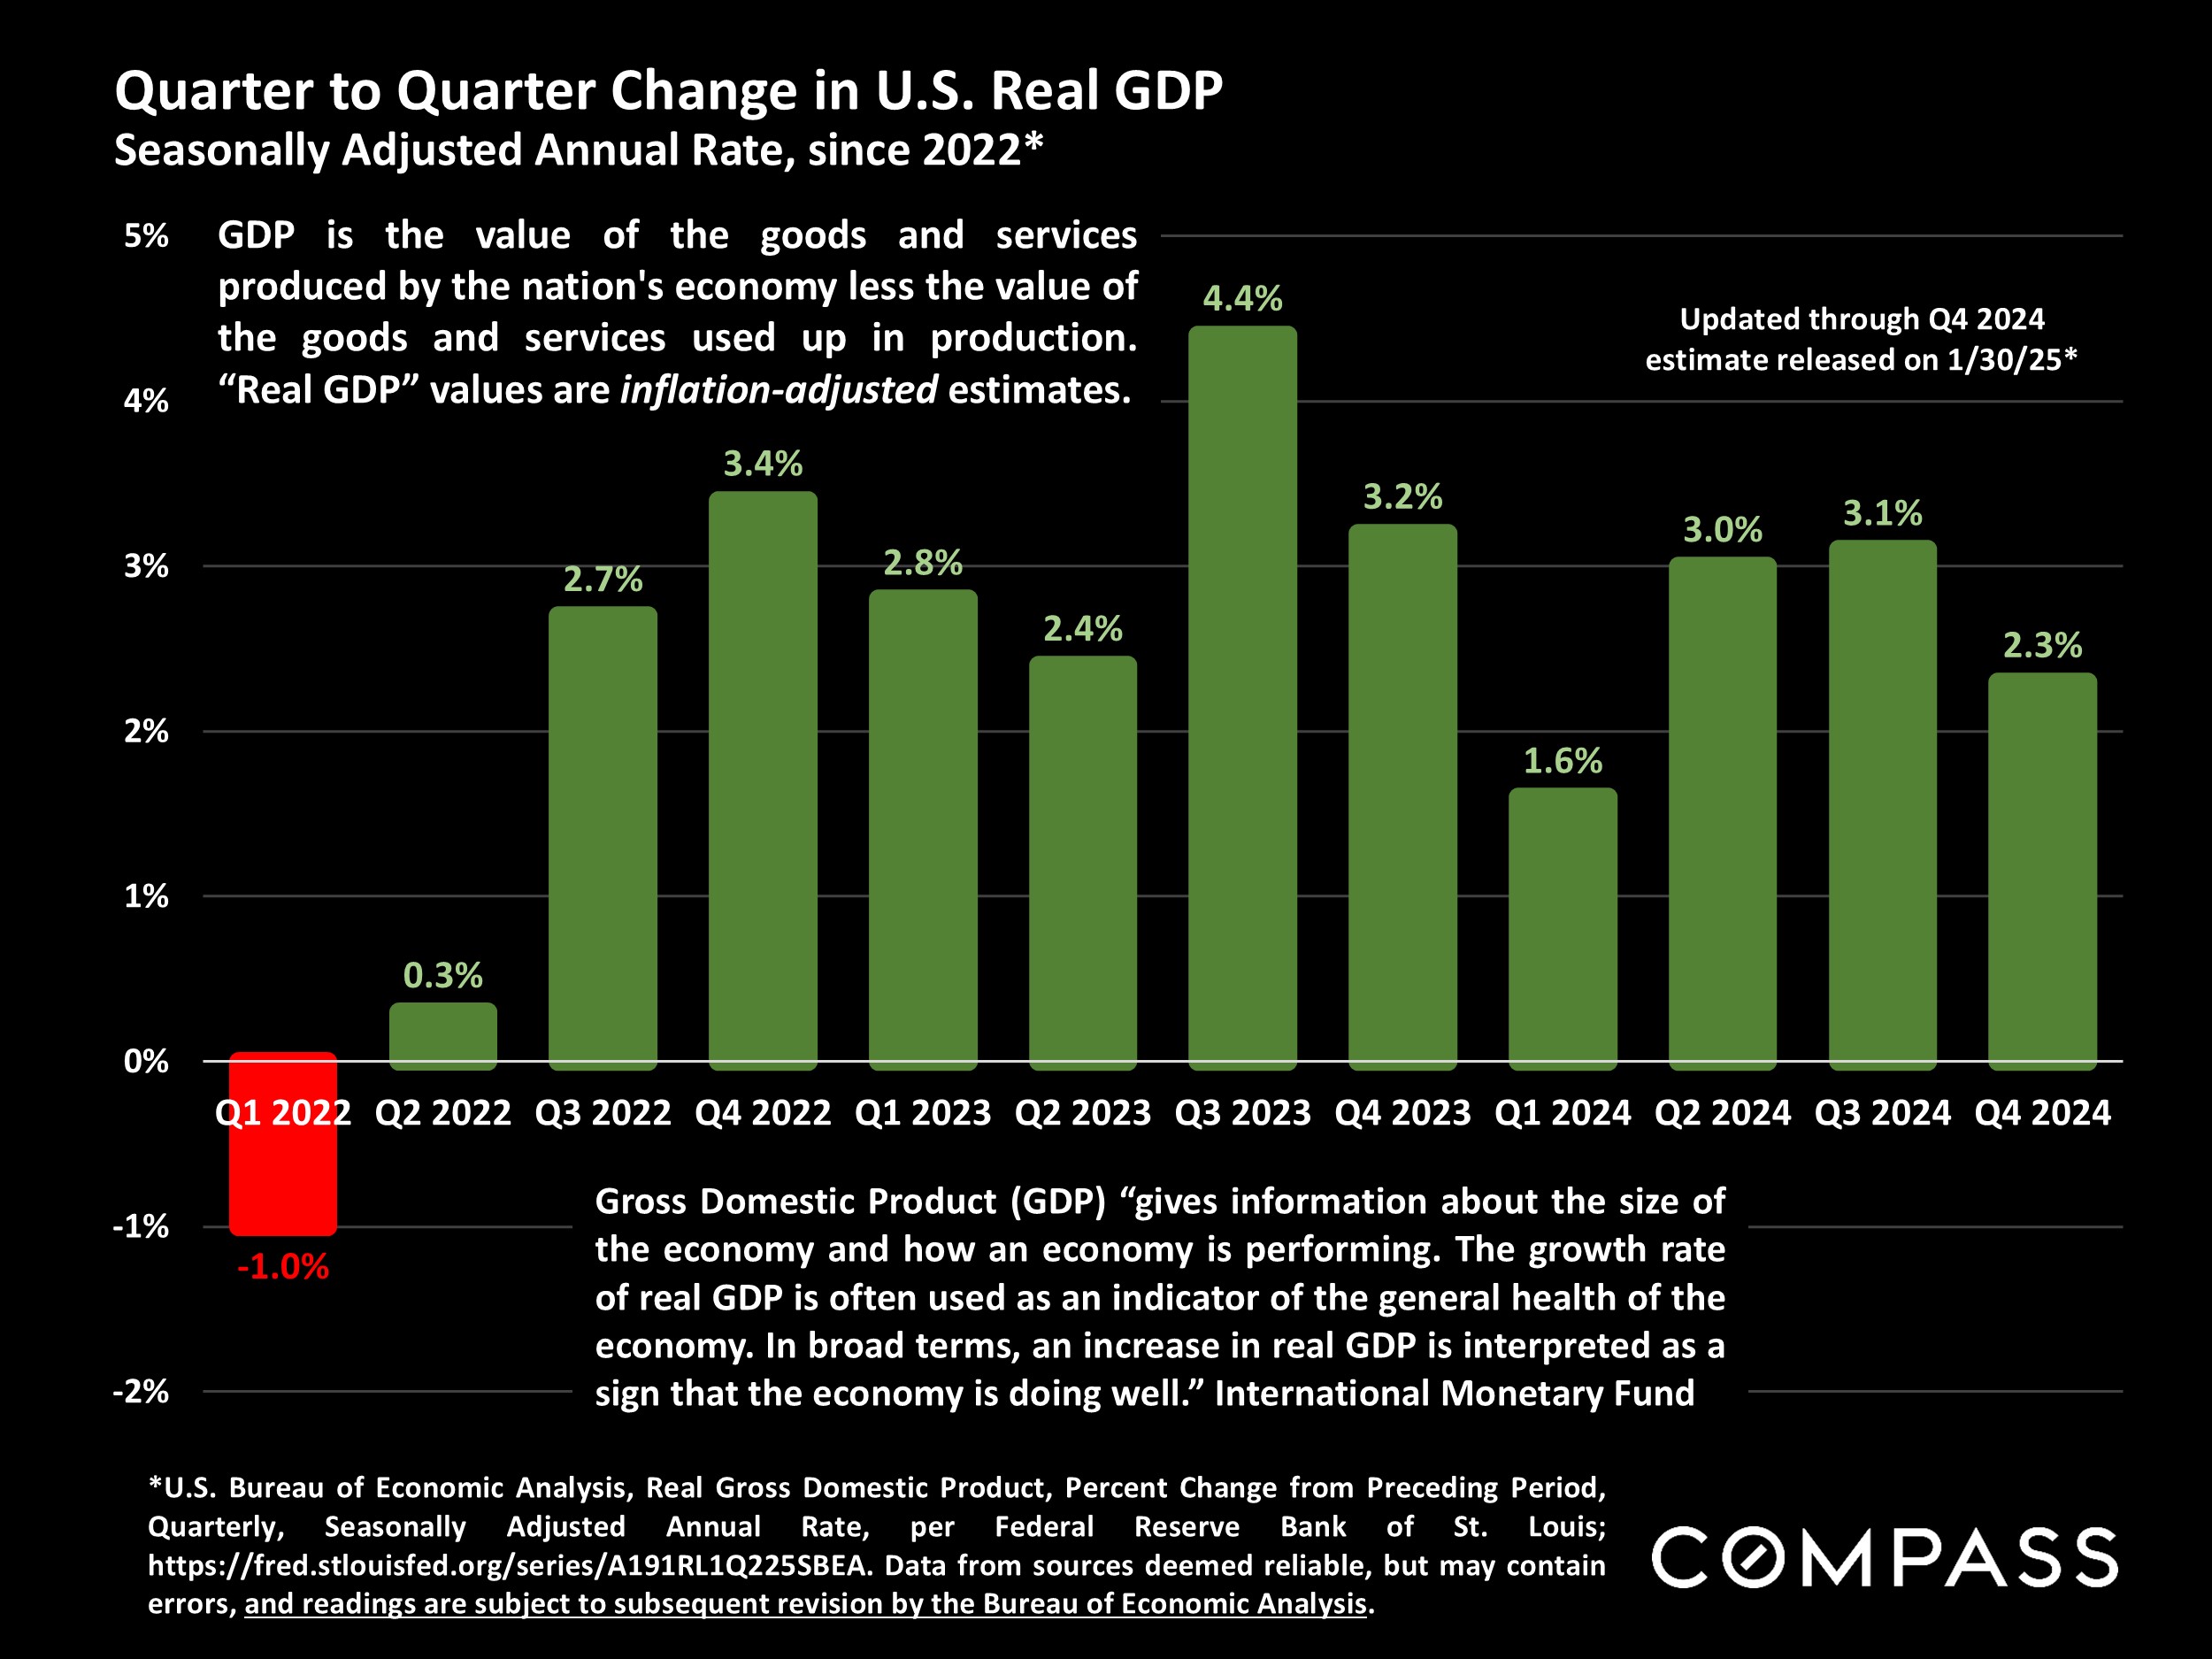
Q4 GDP change was just released: Came in slightly weaker than expected by most economists (but these quarterly numbers are often significantly revised - as the Q3 number has been since its initial release)
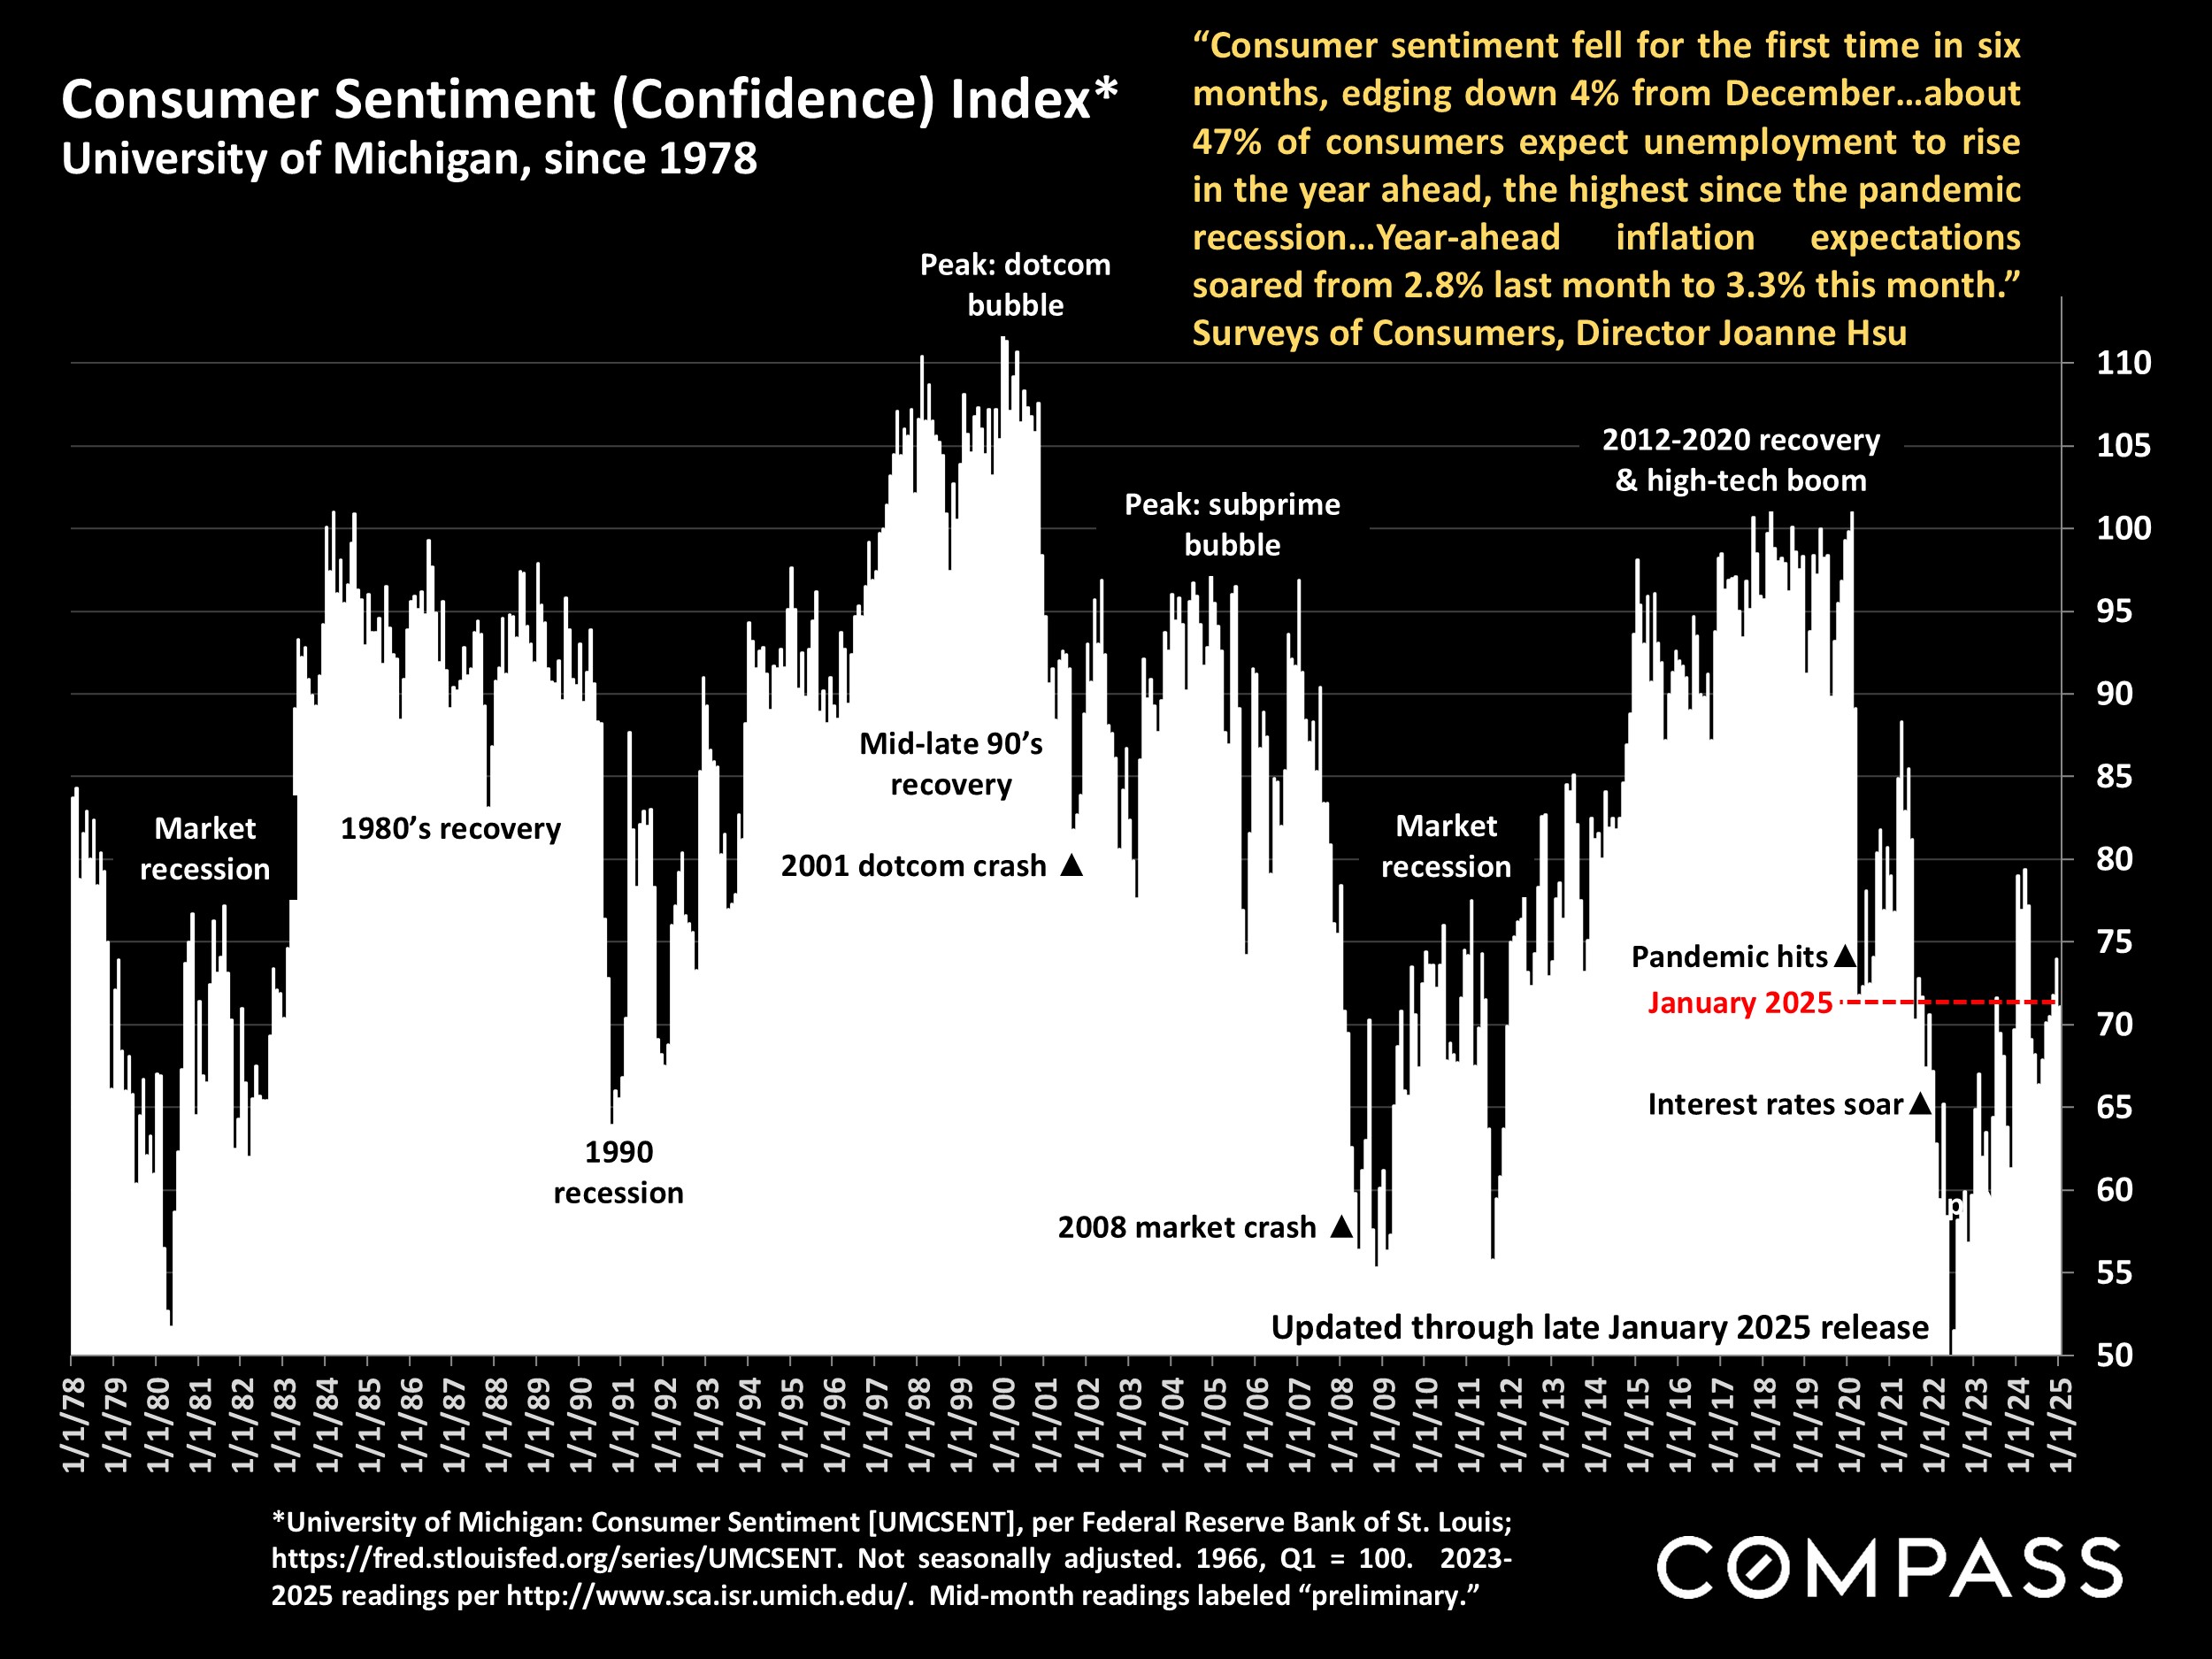
Consumer confidence dropped slightly in the January reading, reflecting some uncertainty as to where the economy is heading.
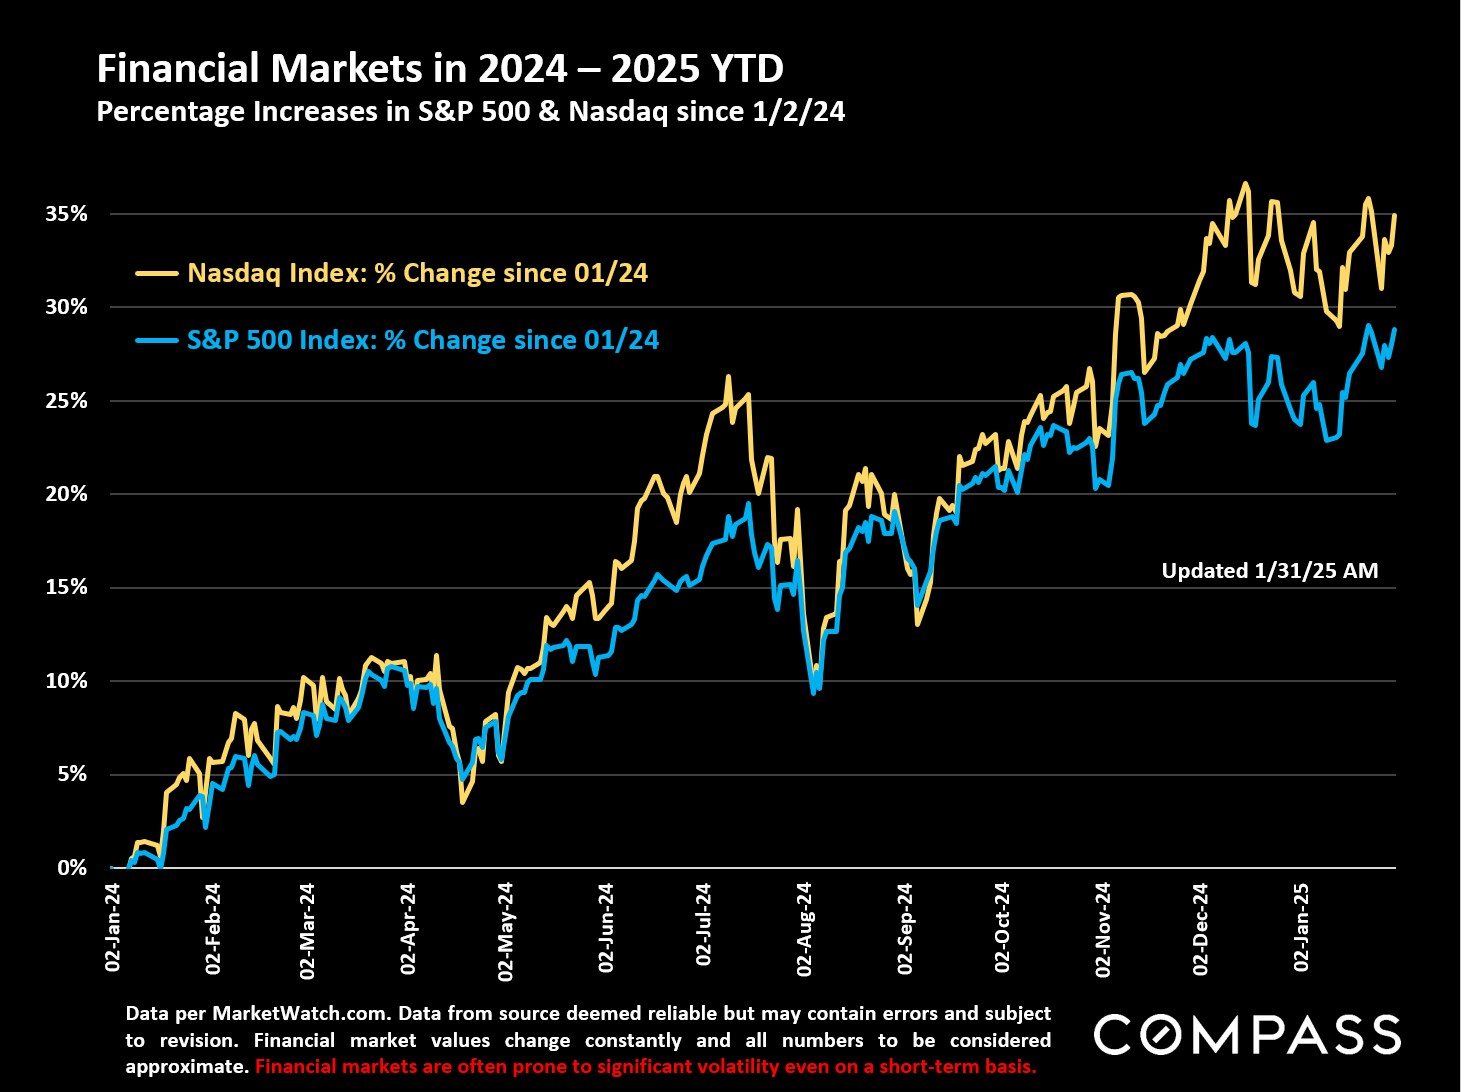
Stock markets have been rebounding from their "DeepSeek" plunge a few days back.
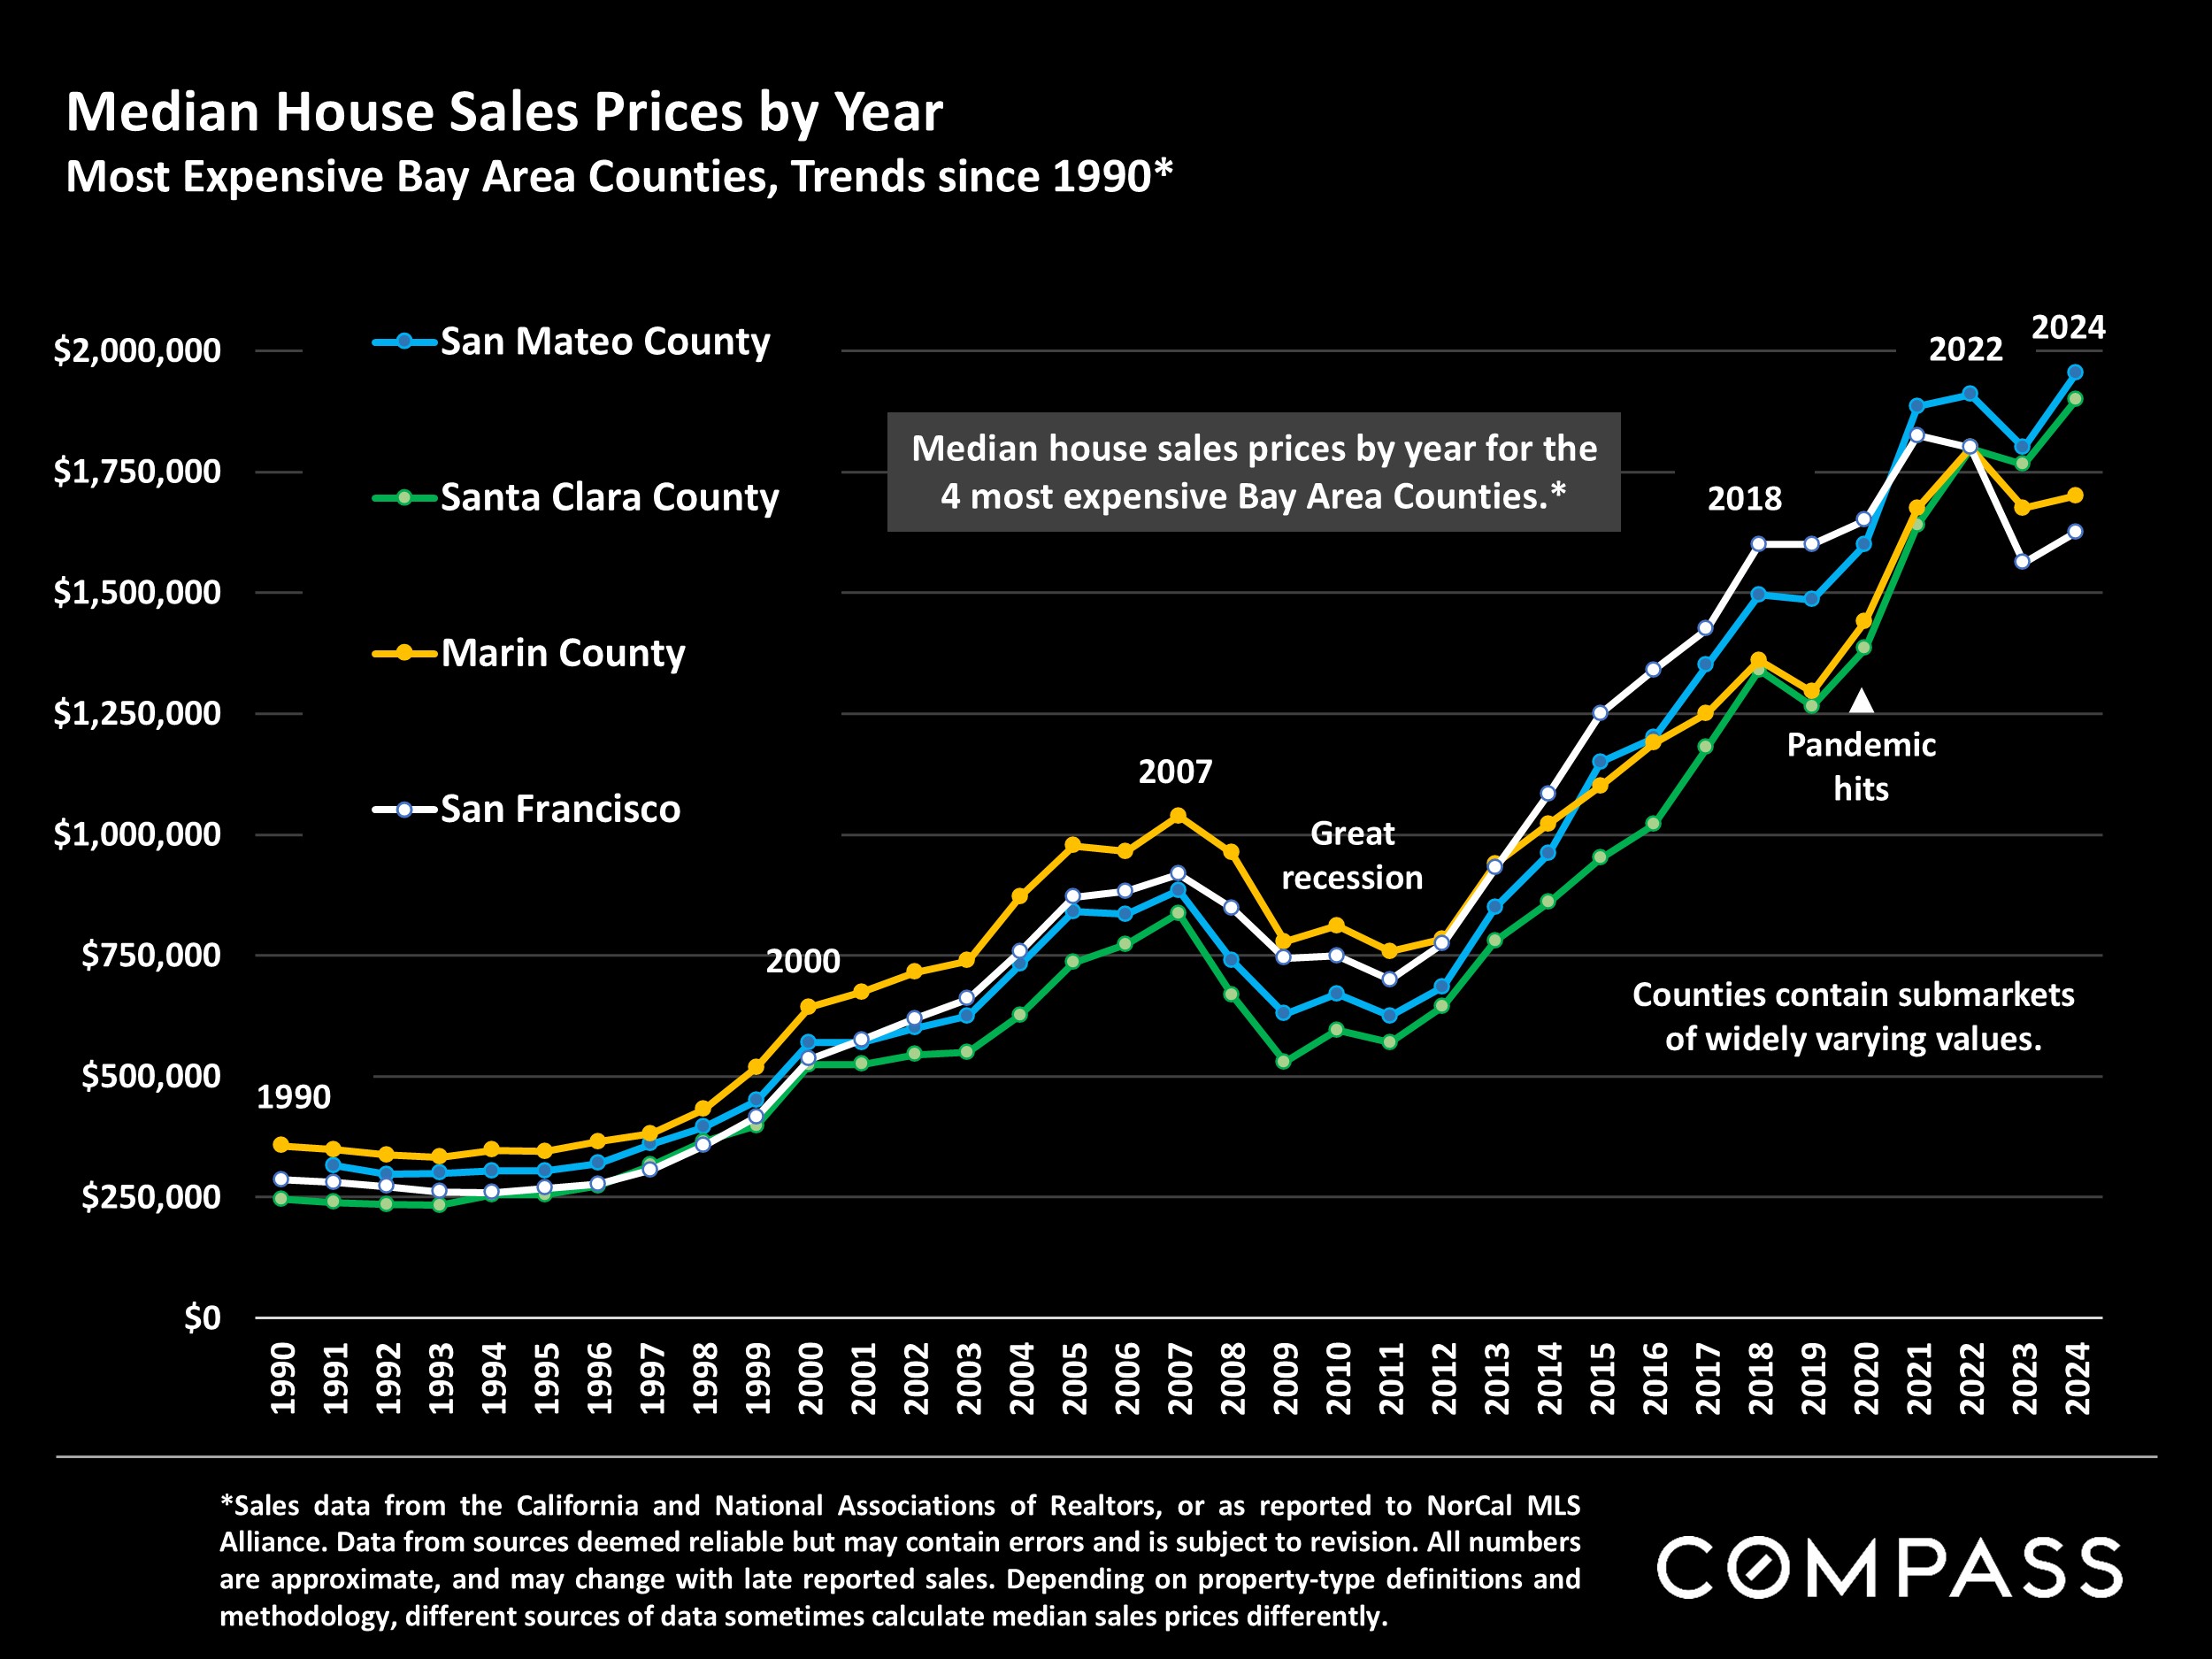
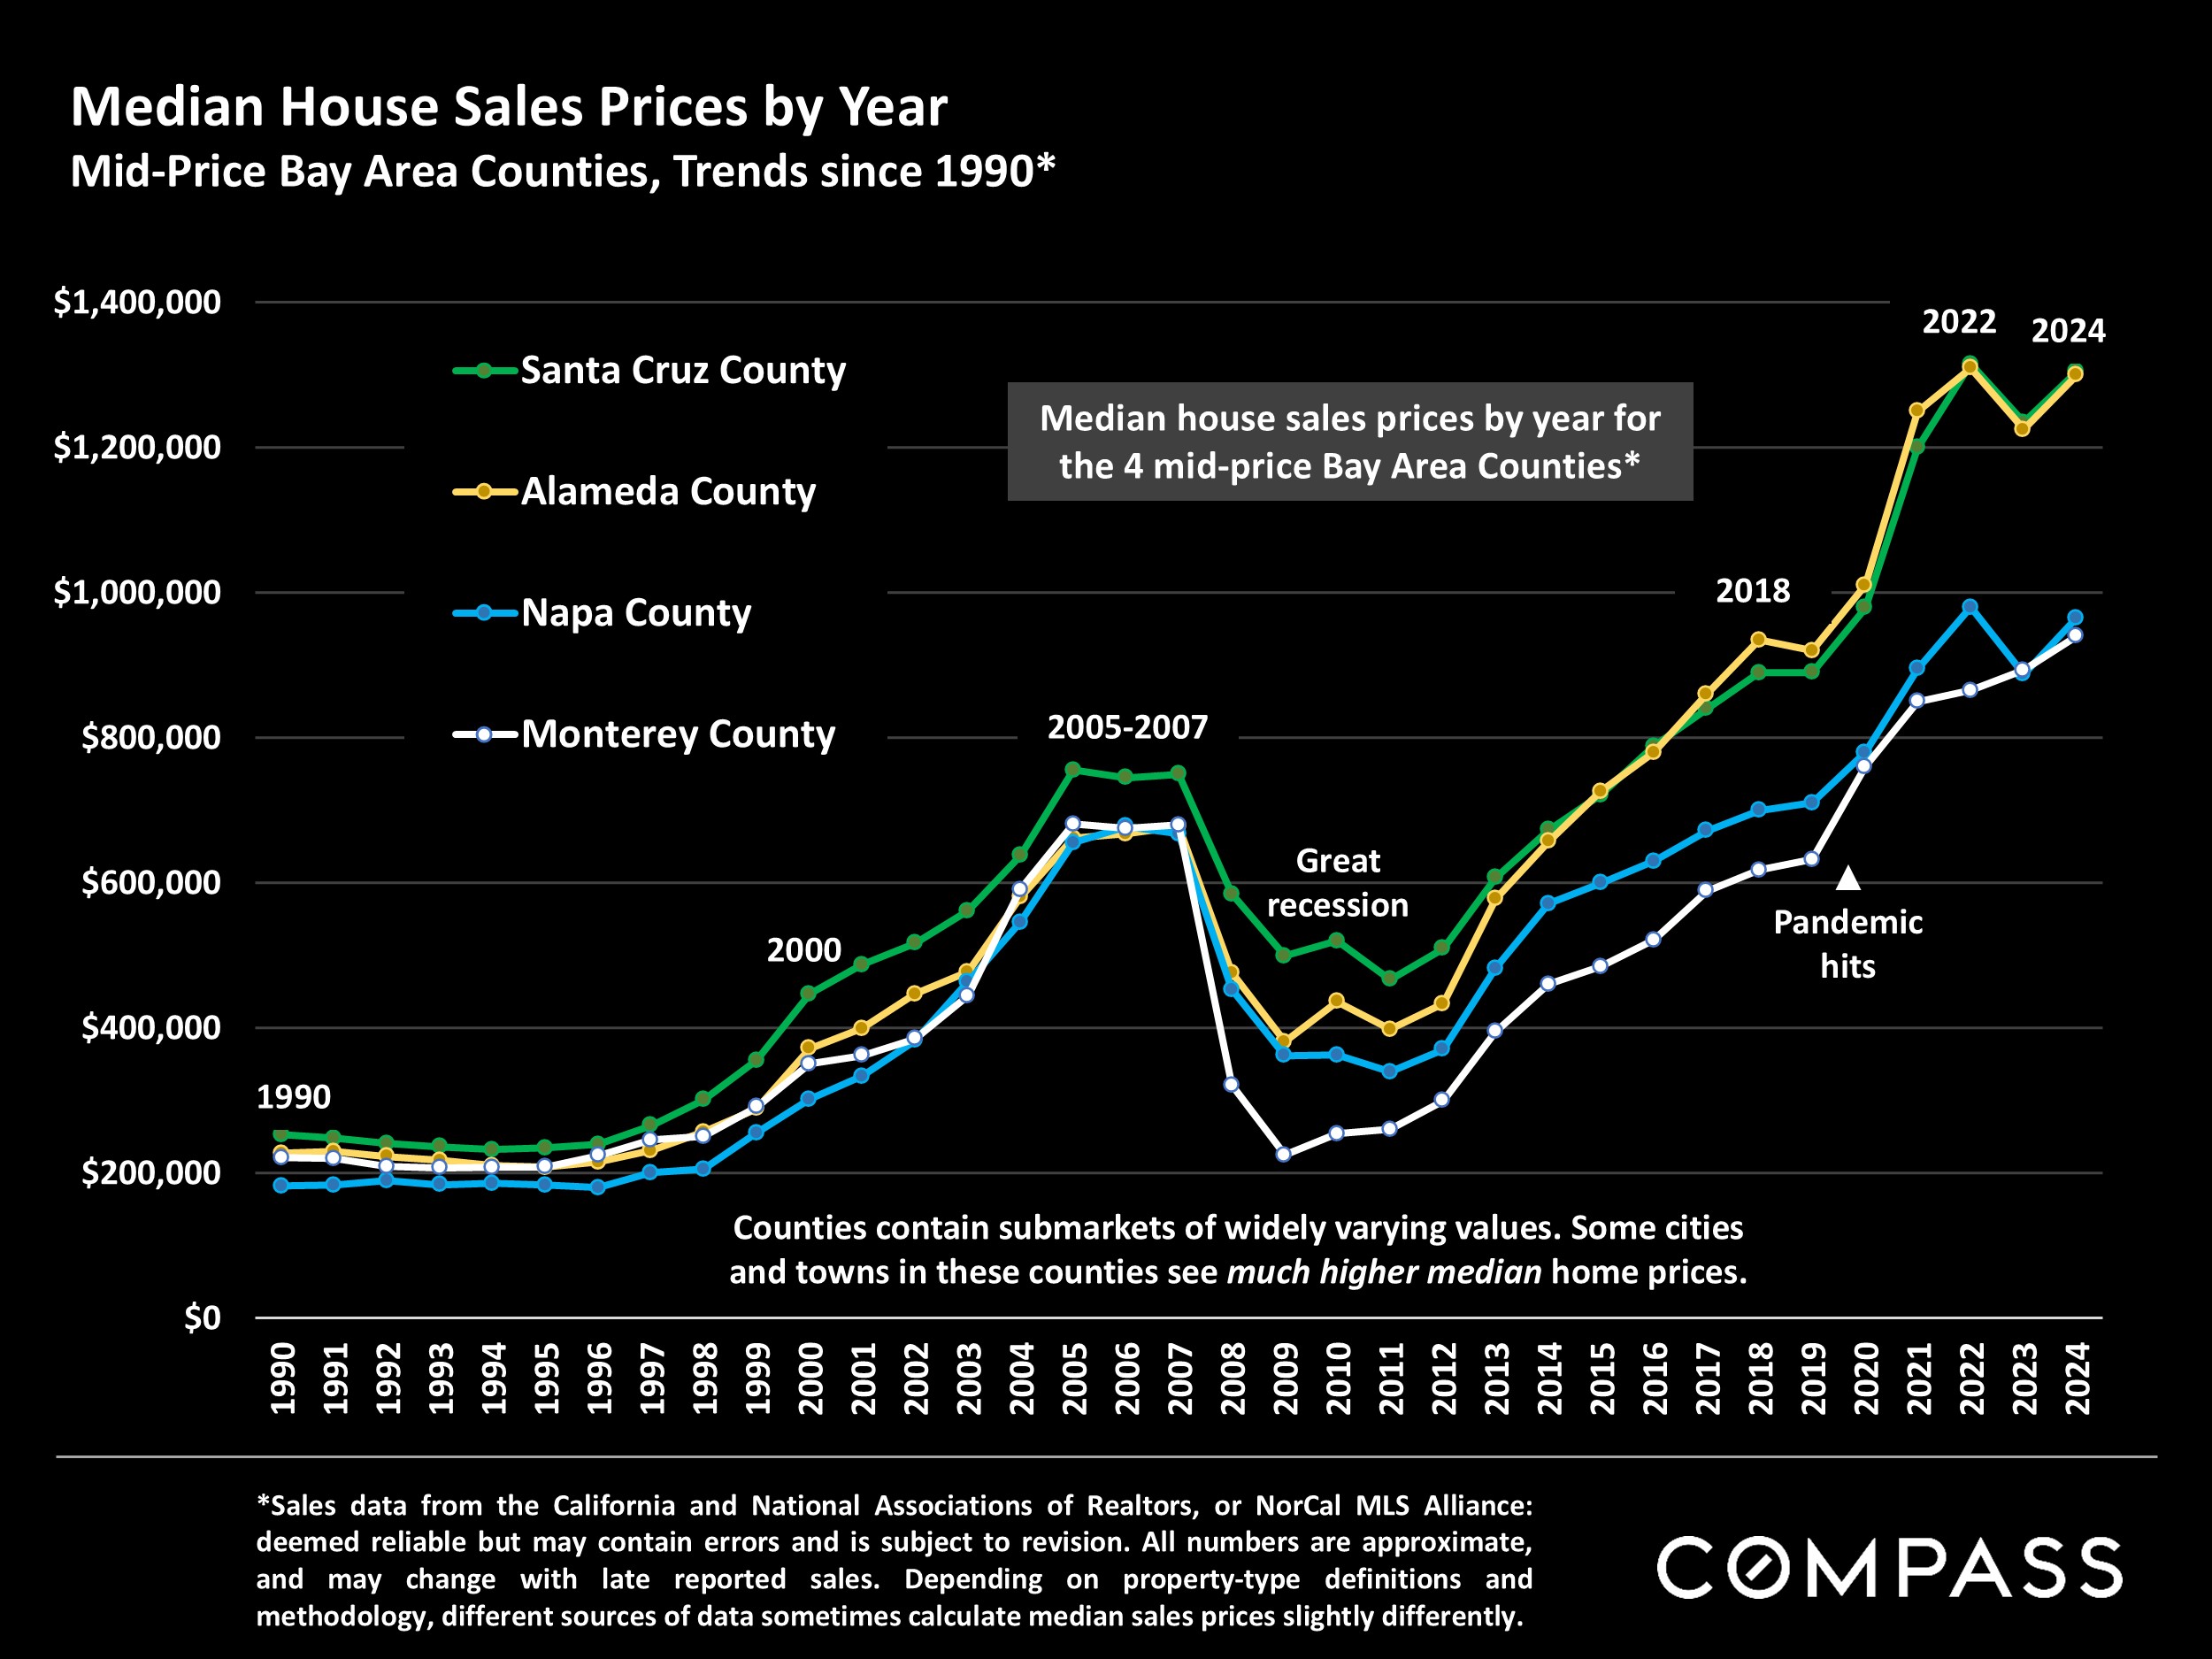
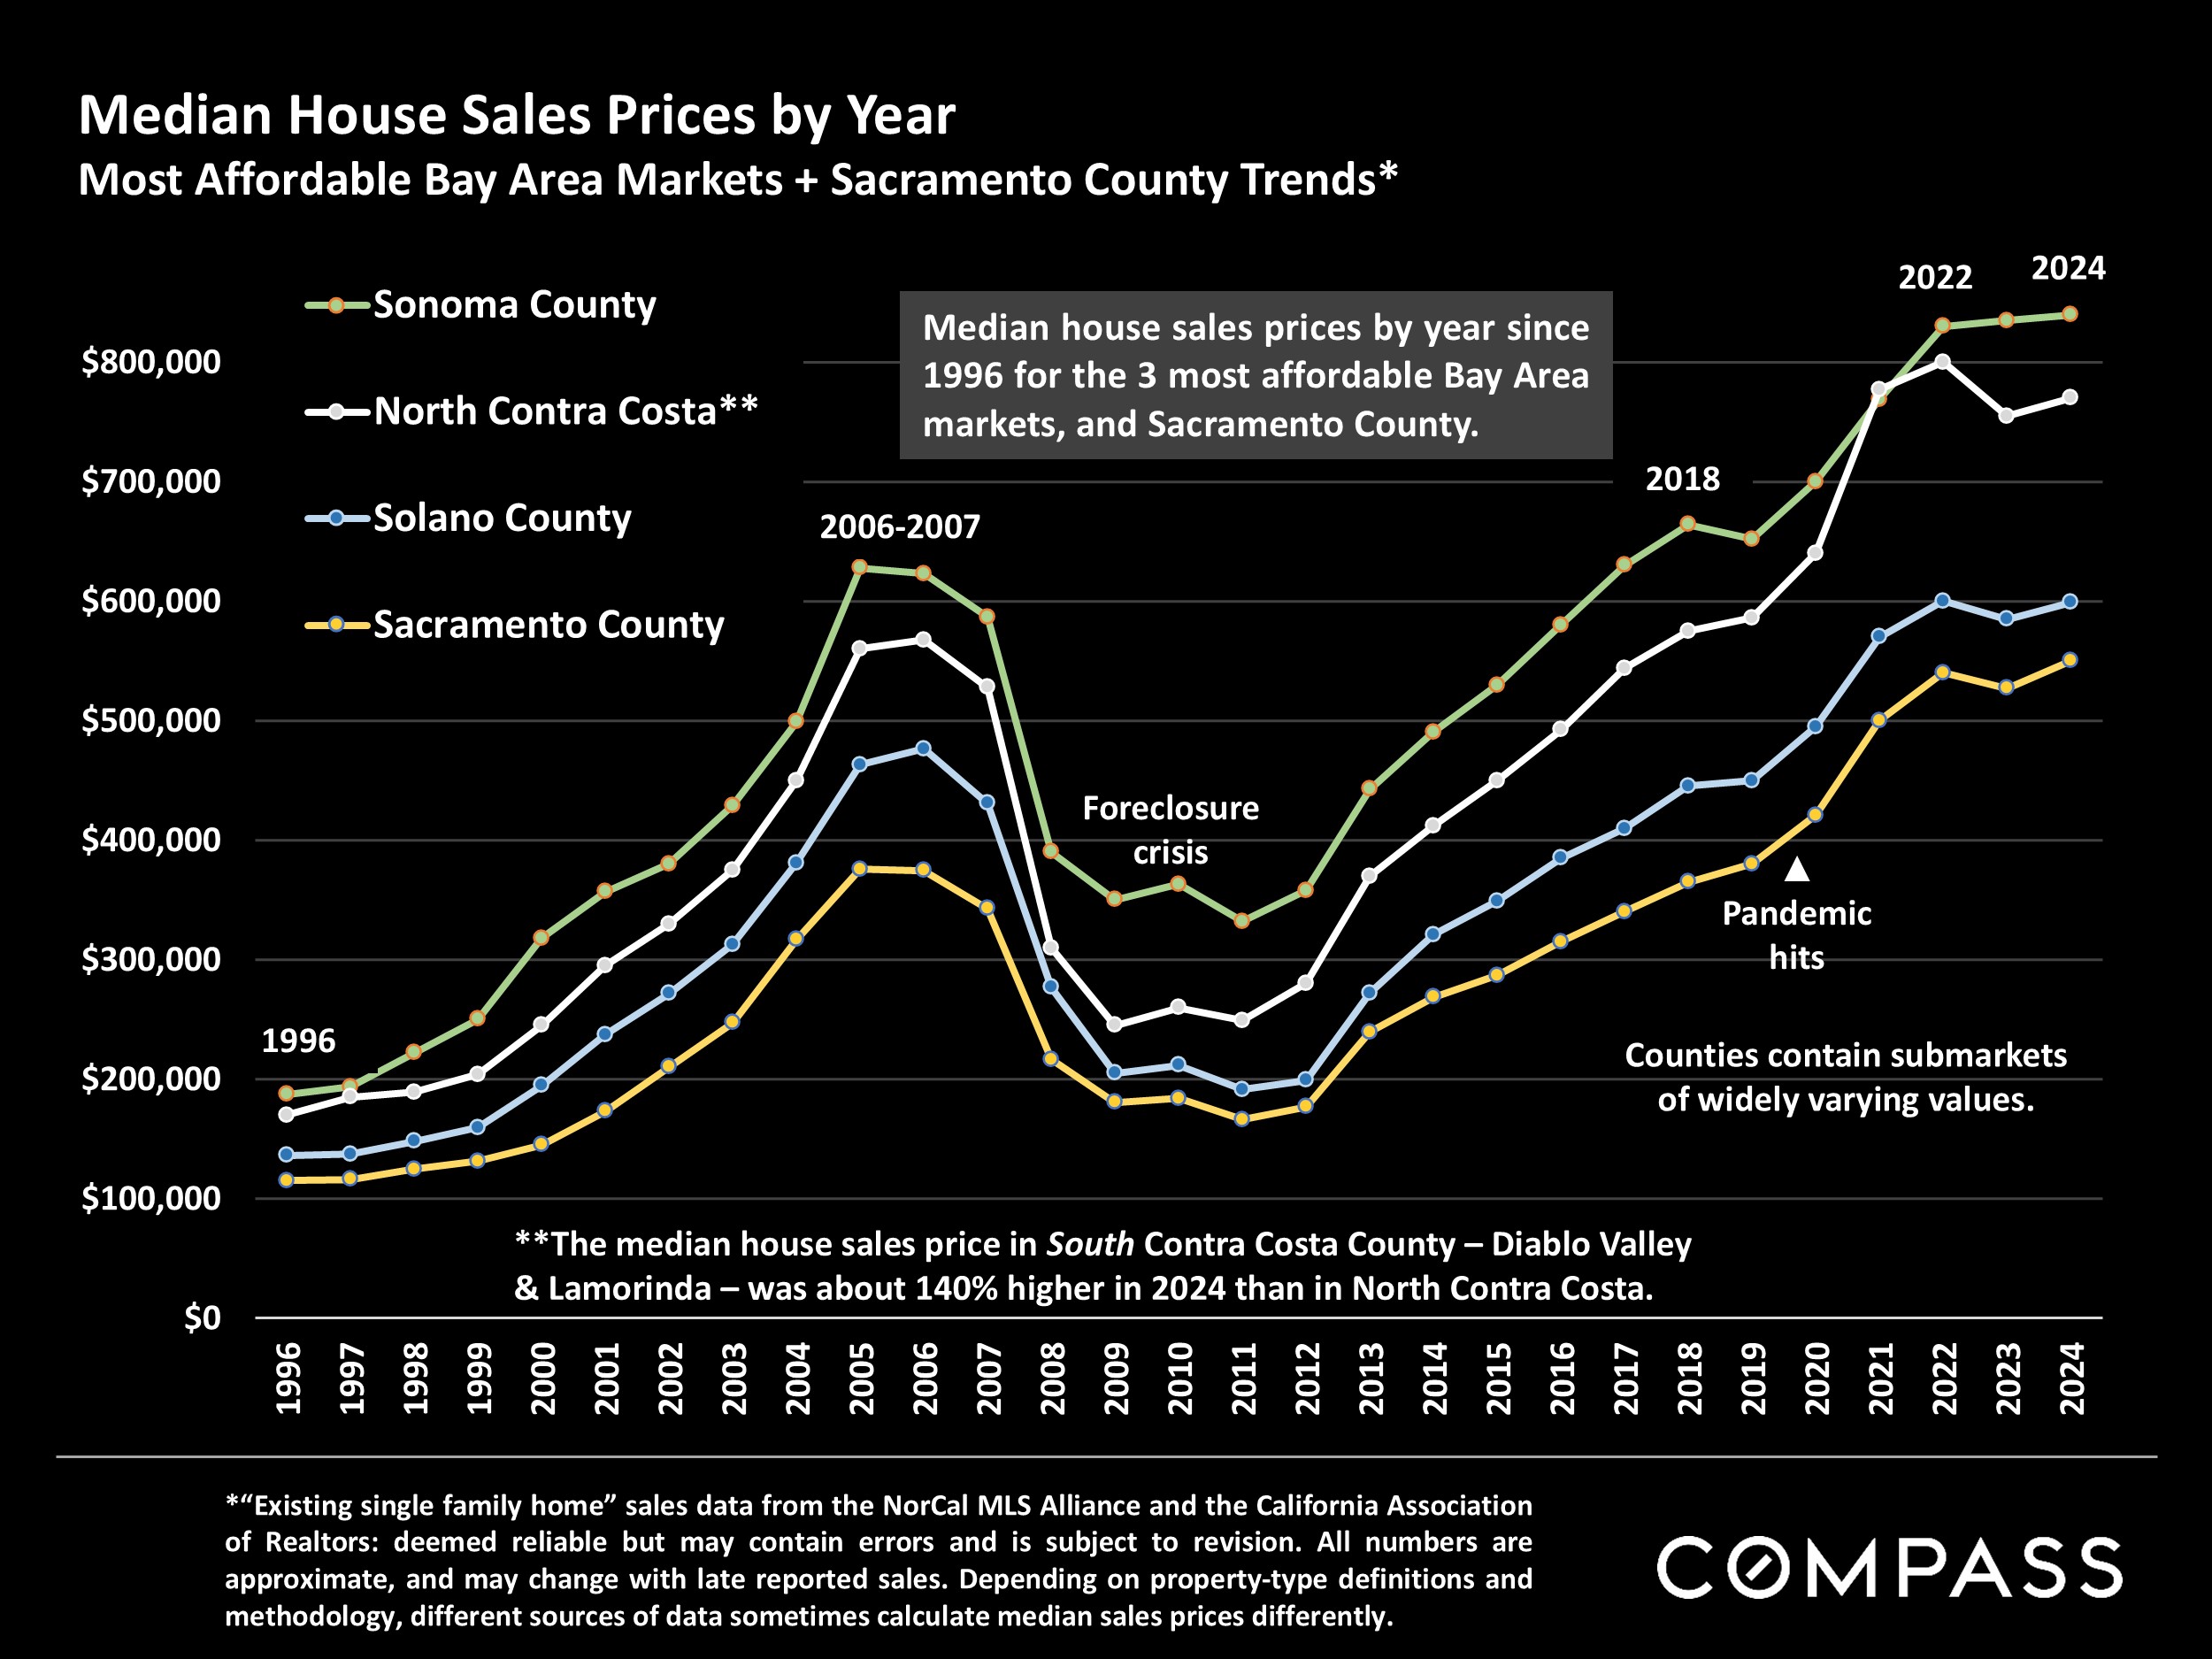
Another angle on Bay Area + Sacramento median house price changes over the long-term: All markets up from 2023, some hitting new price peaks. (See January newsletters for individual county/regional charts.)
The latest numbers and map, through 2024, regarding billion-dollar+ weather-
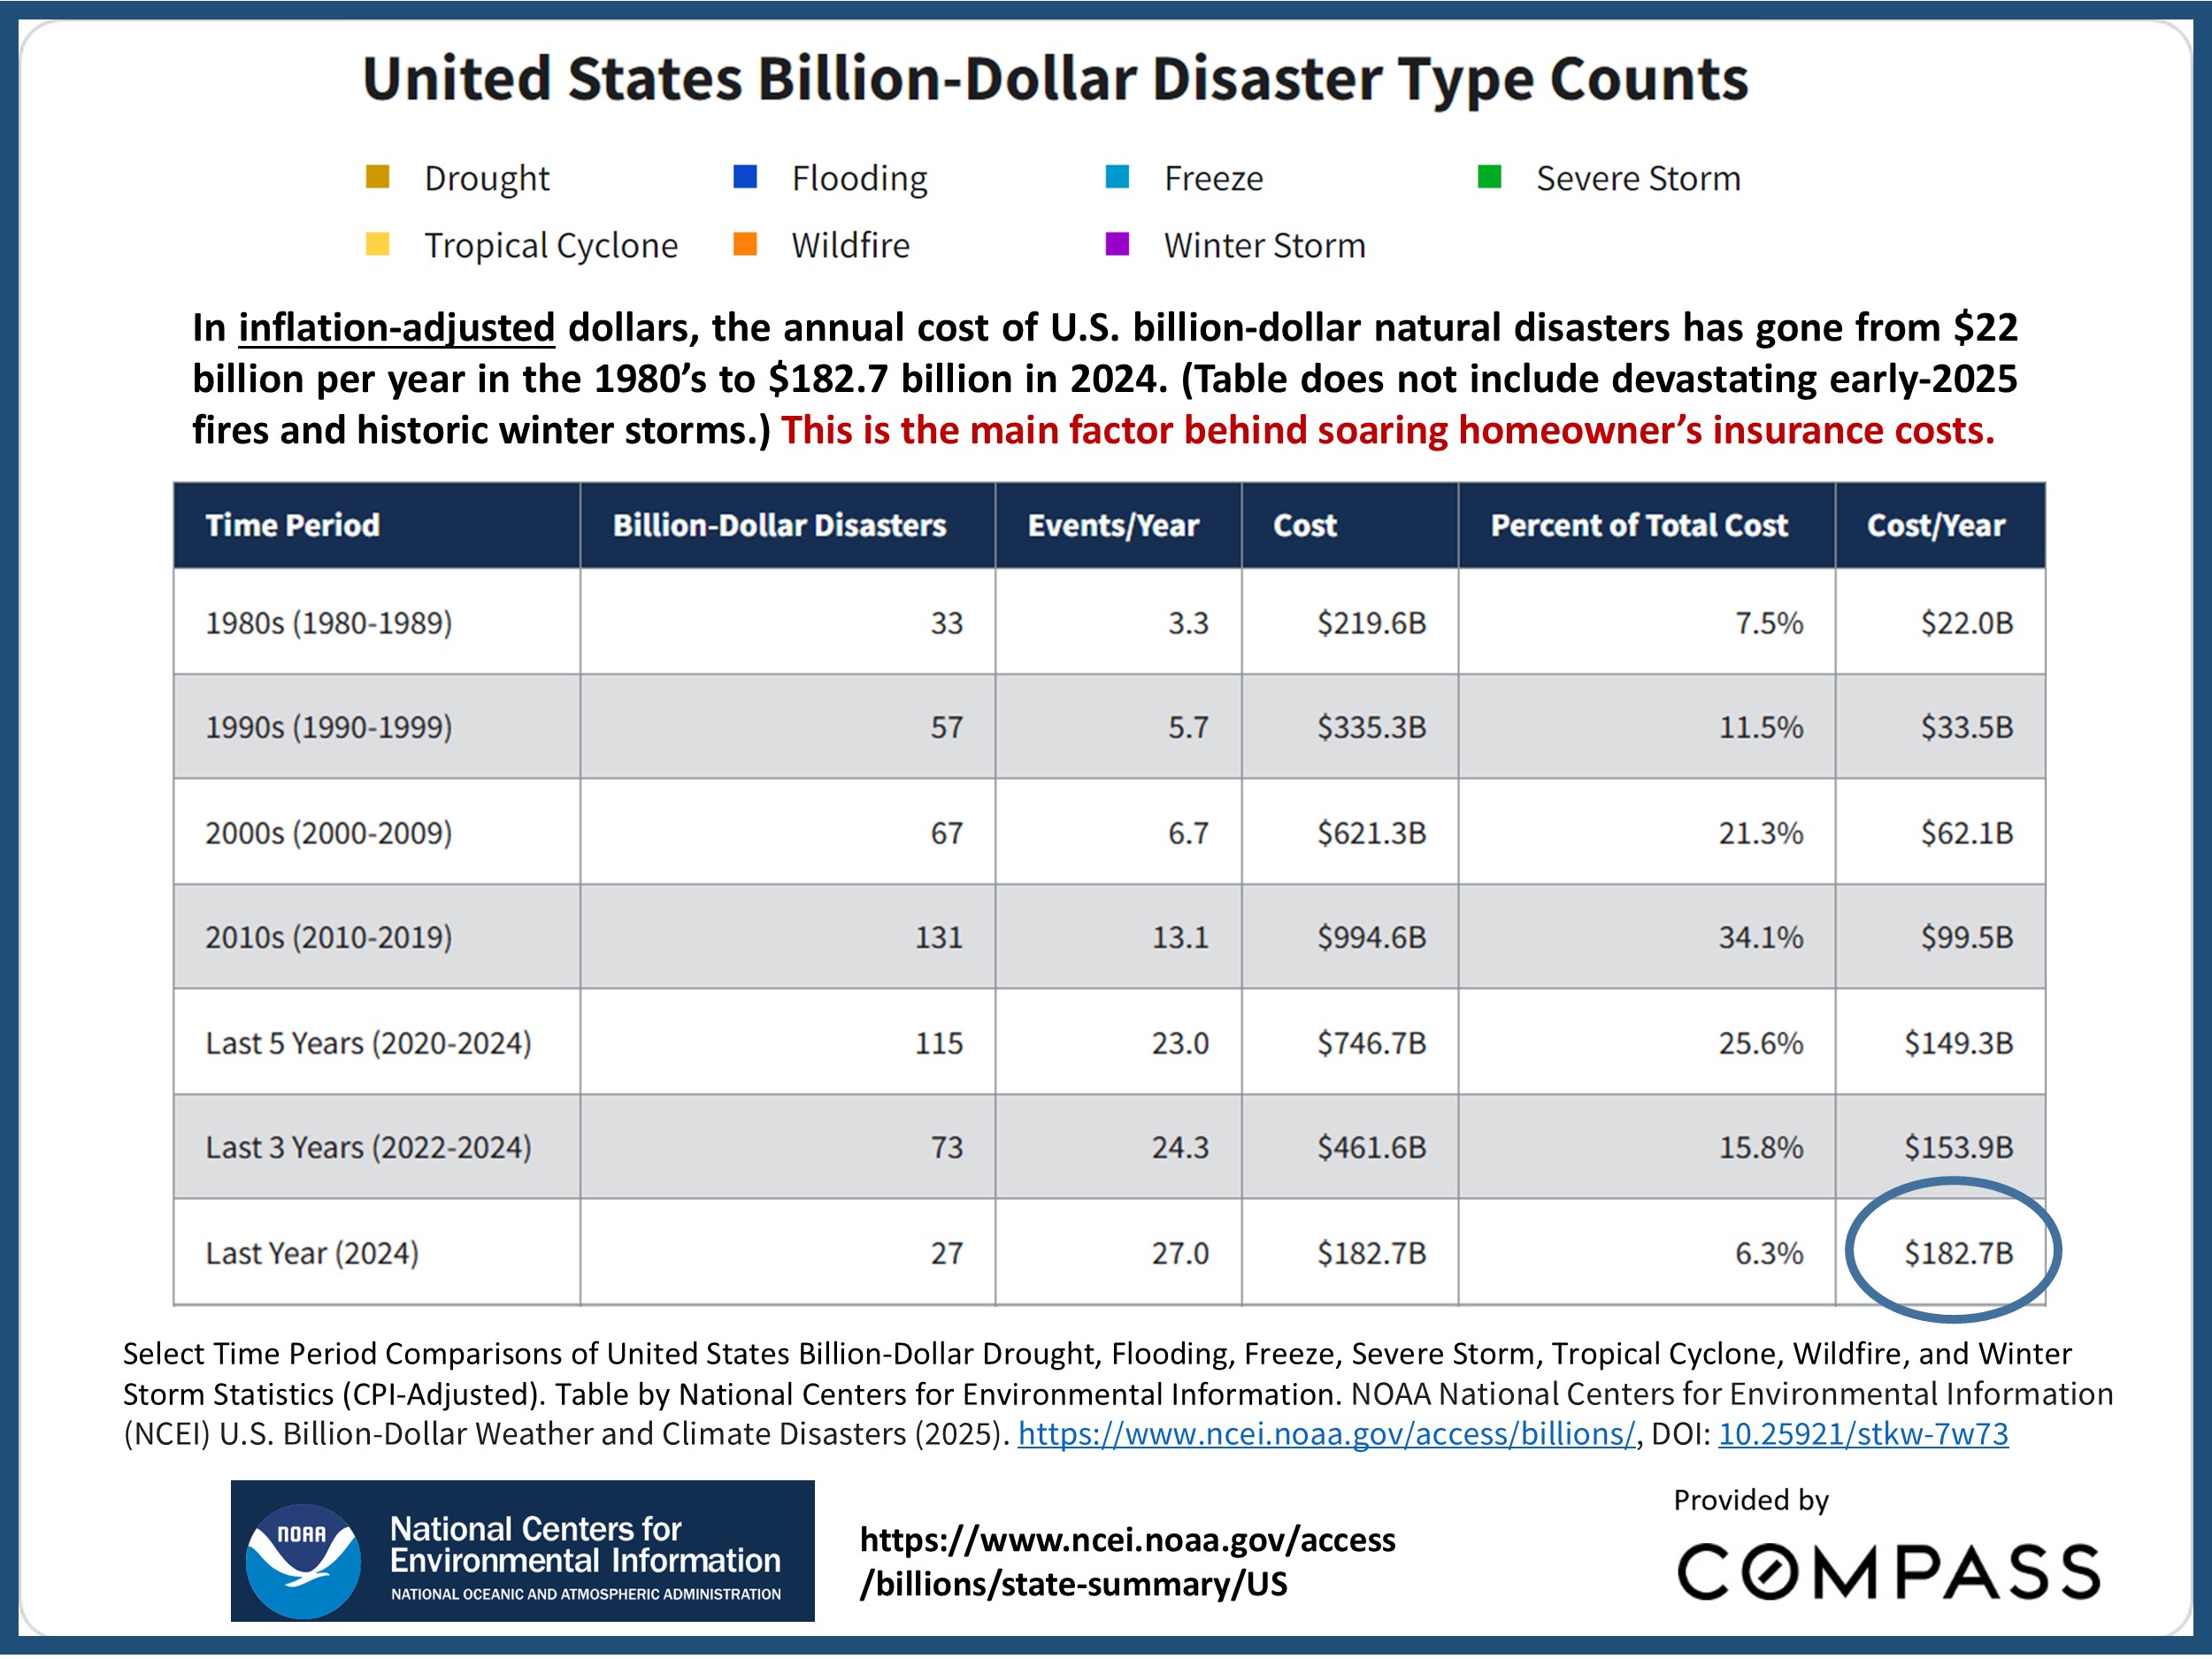
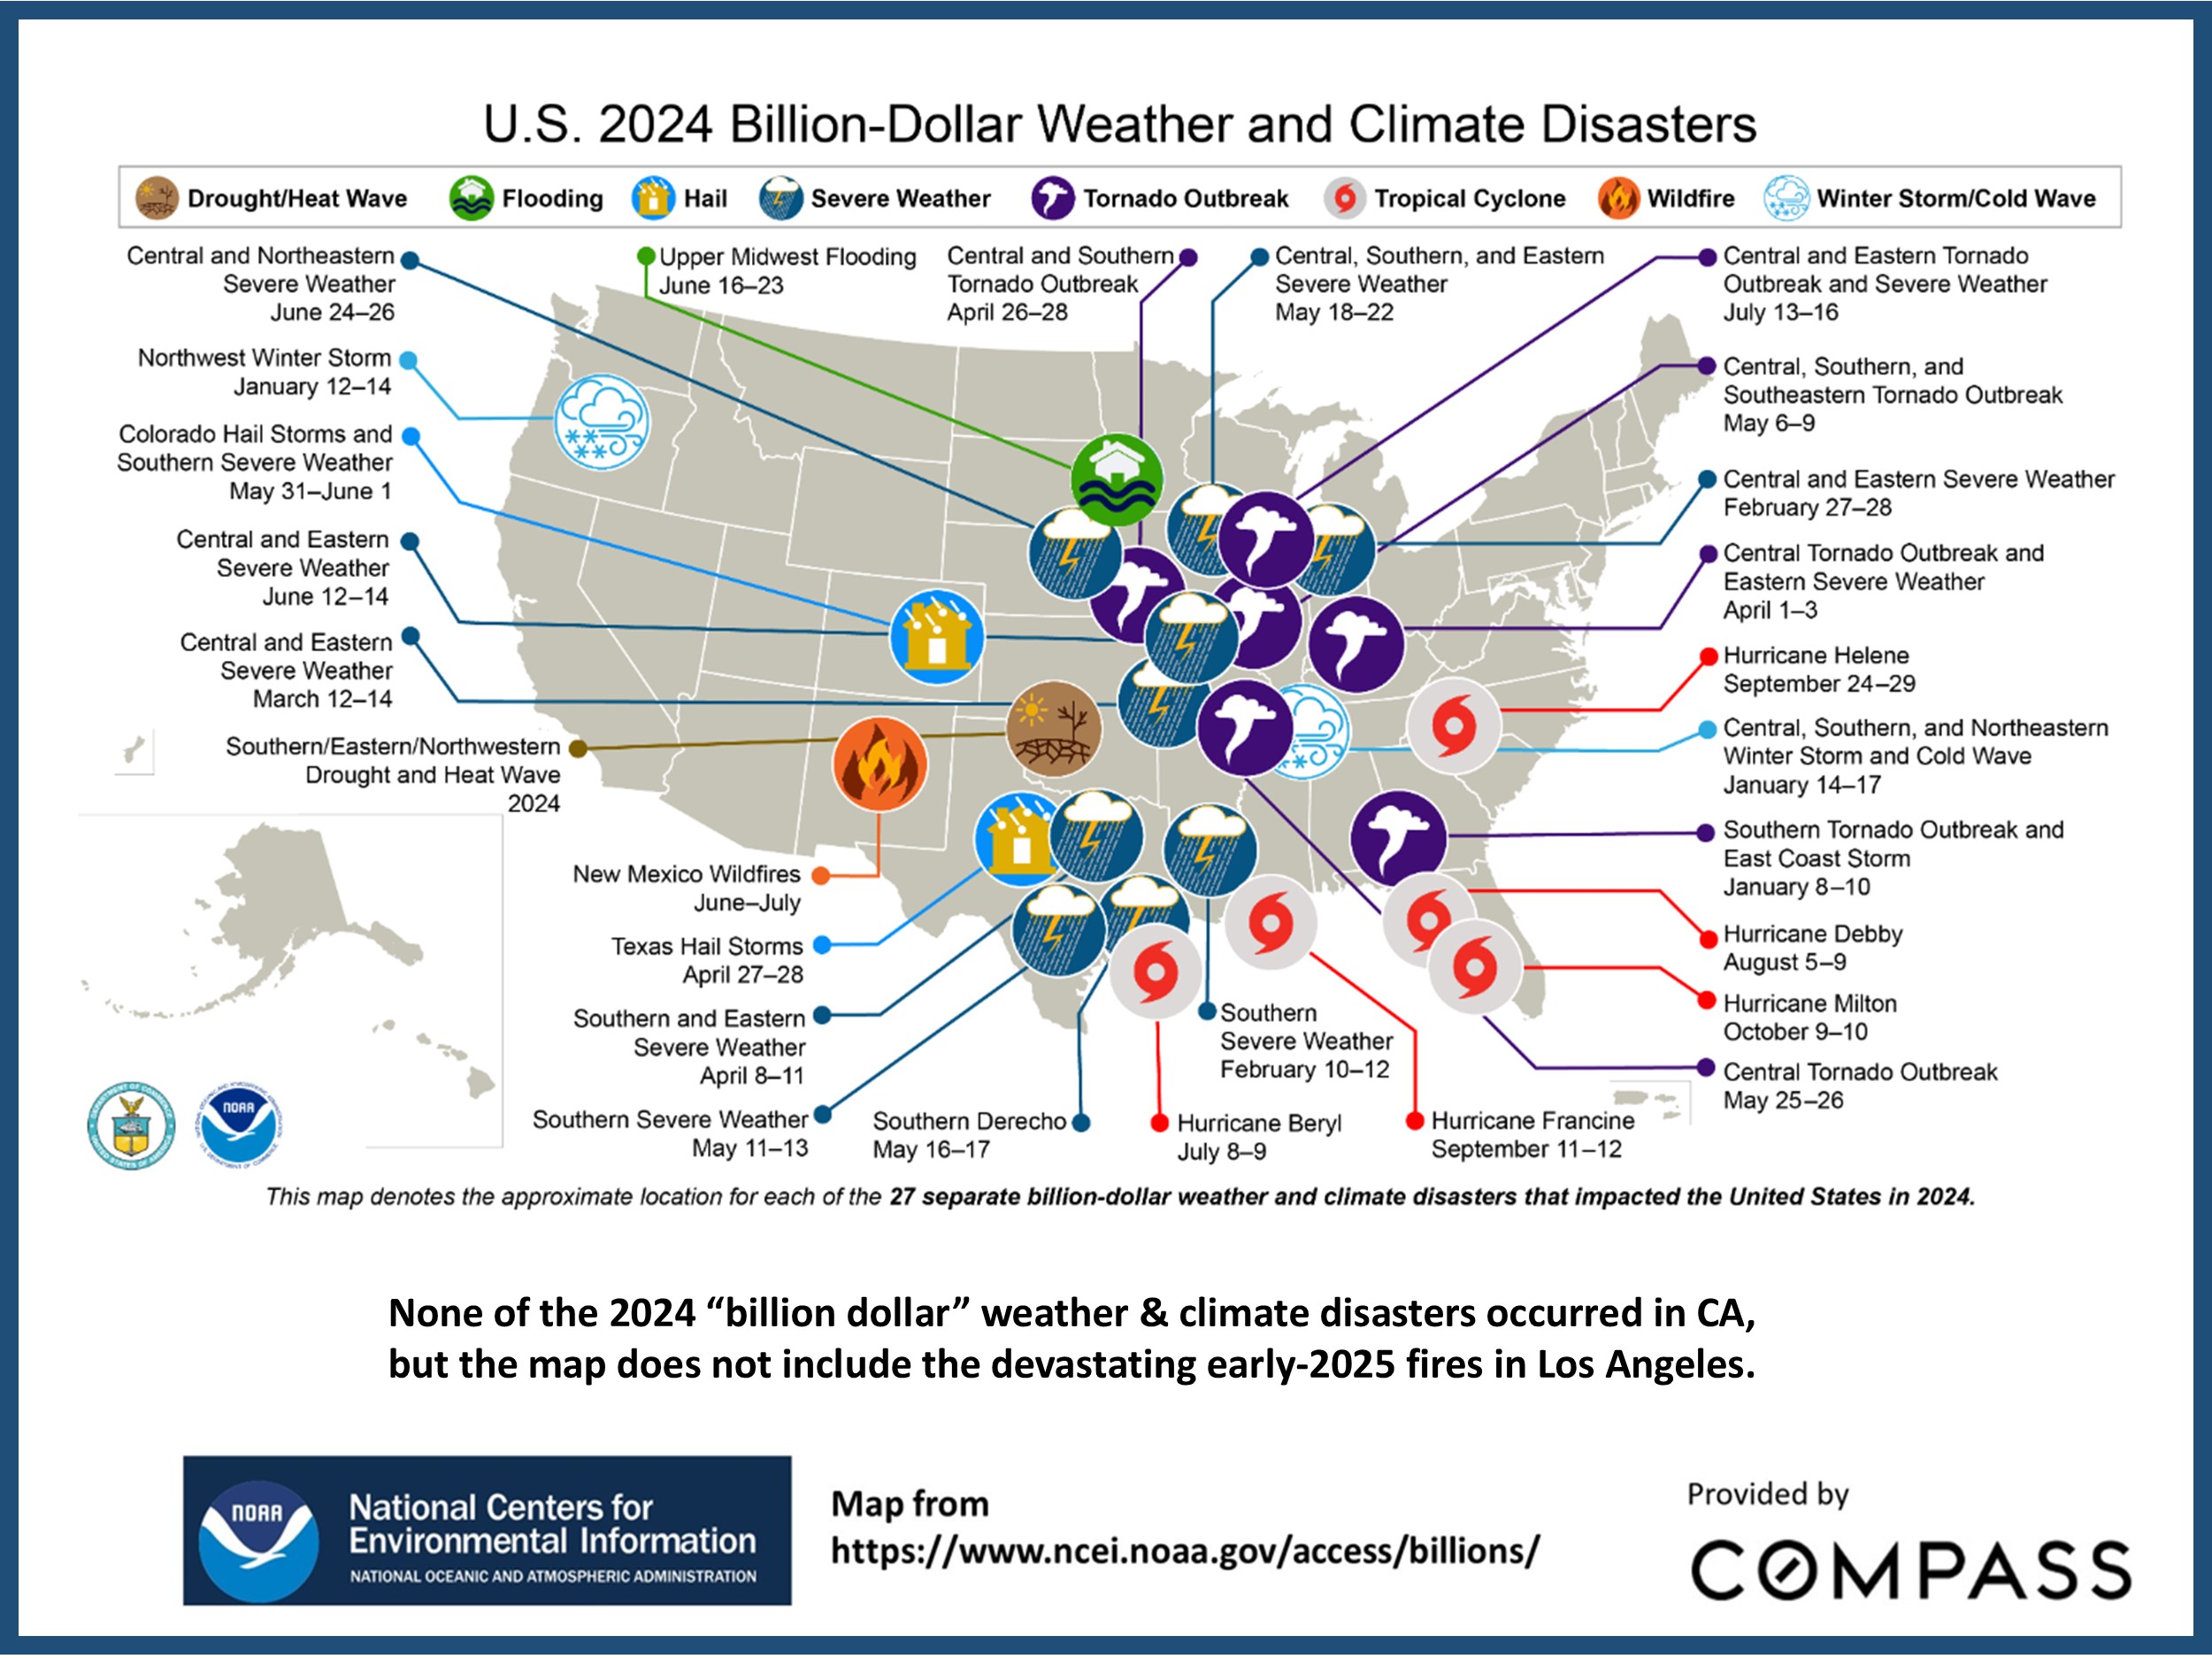
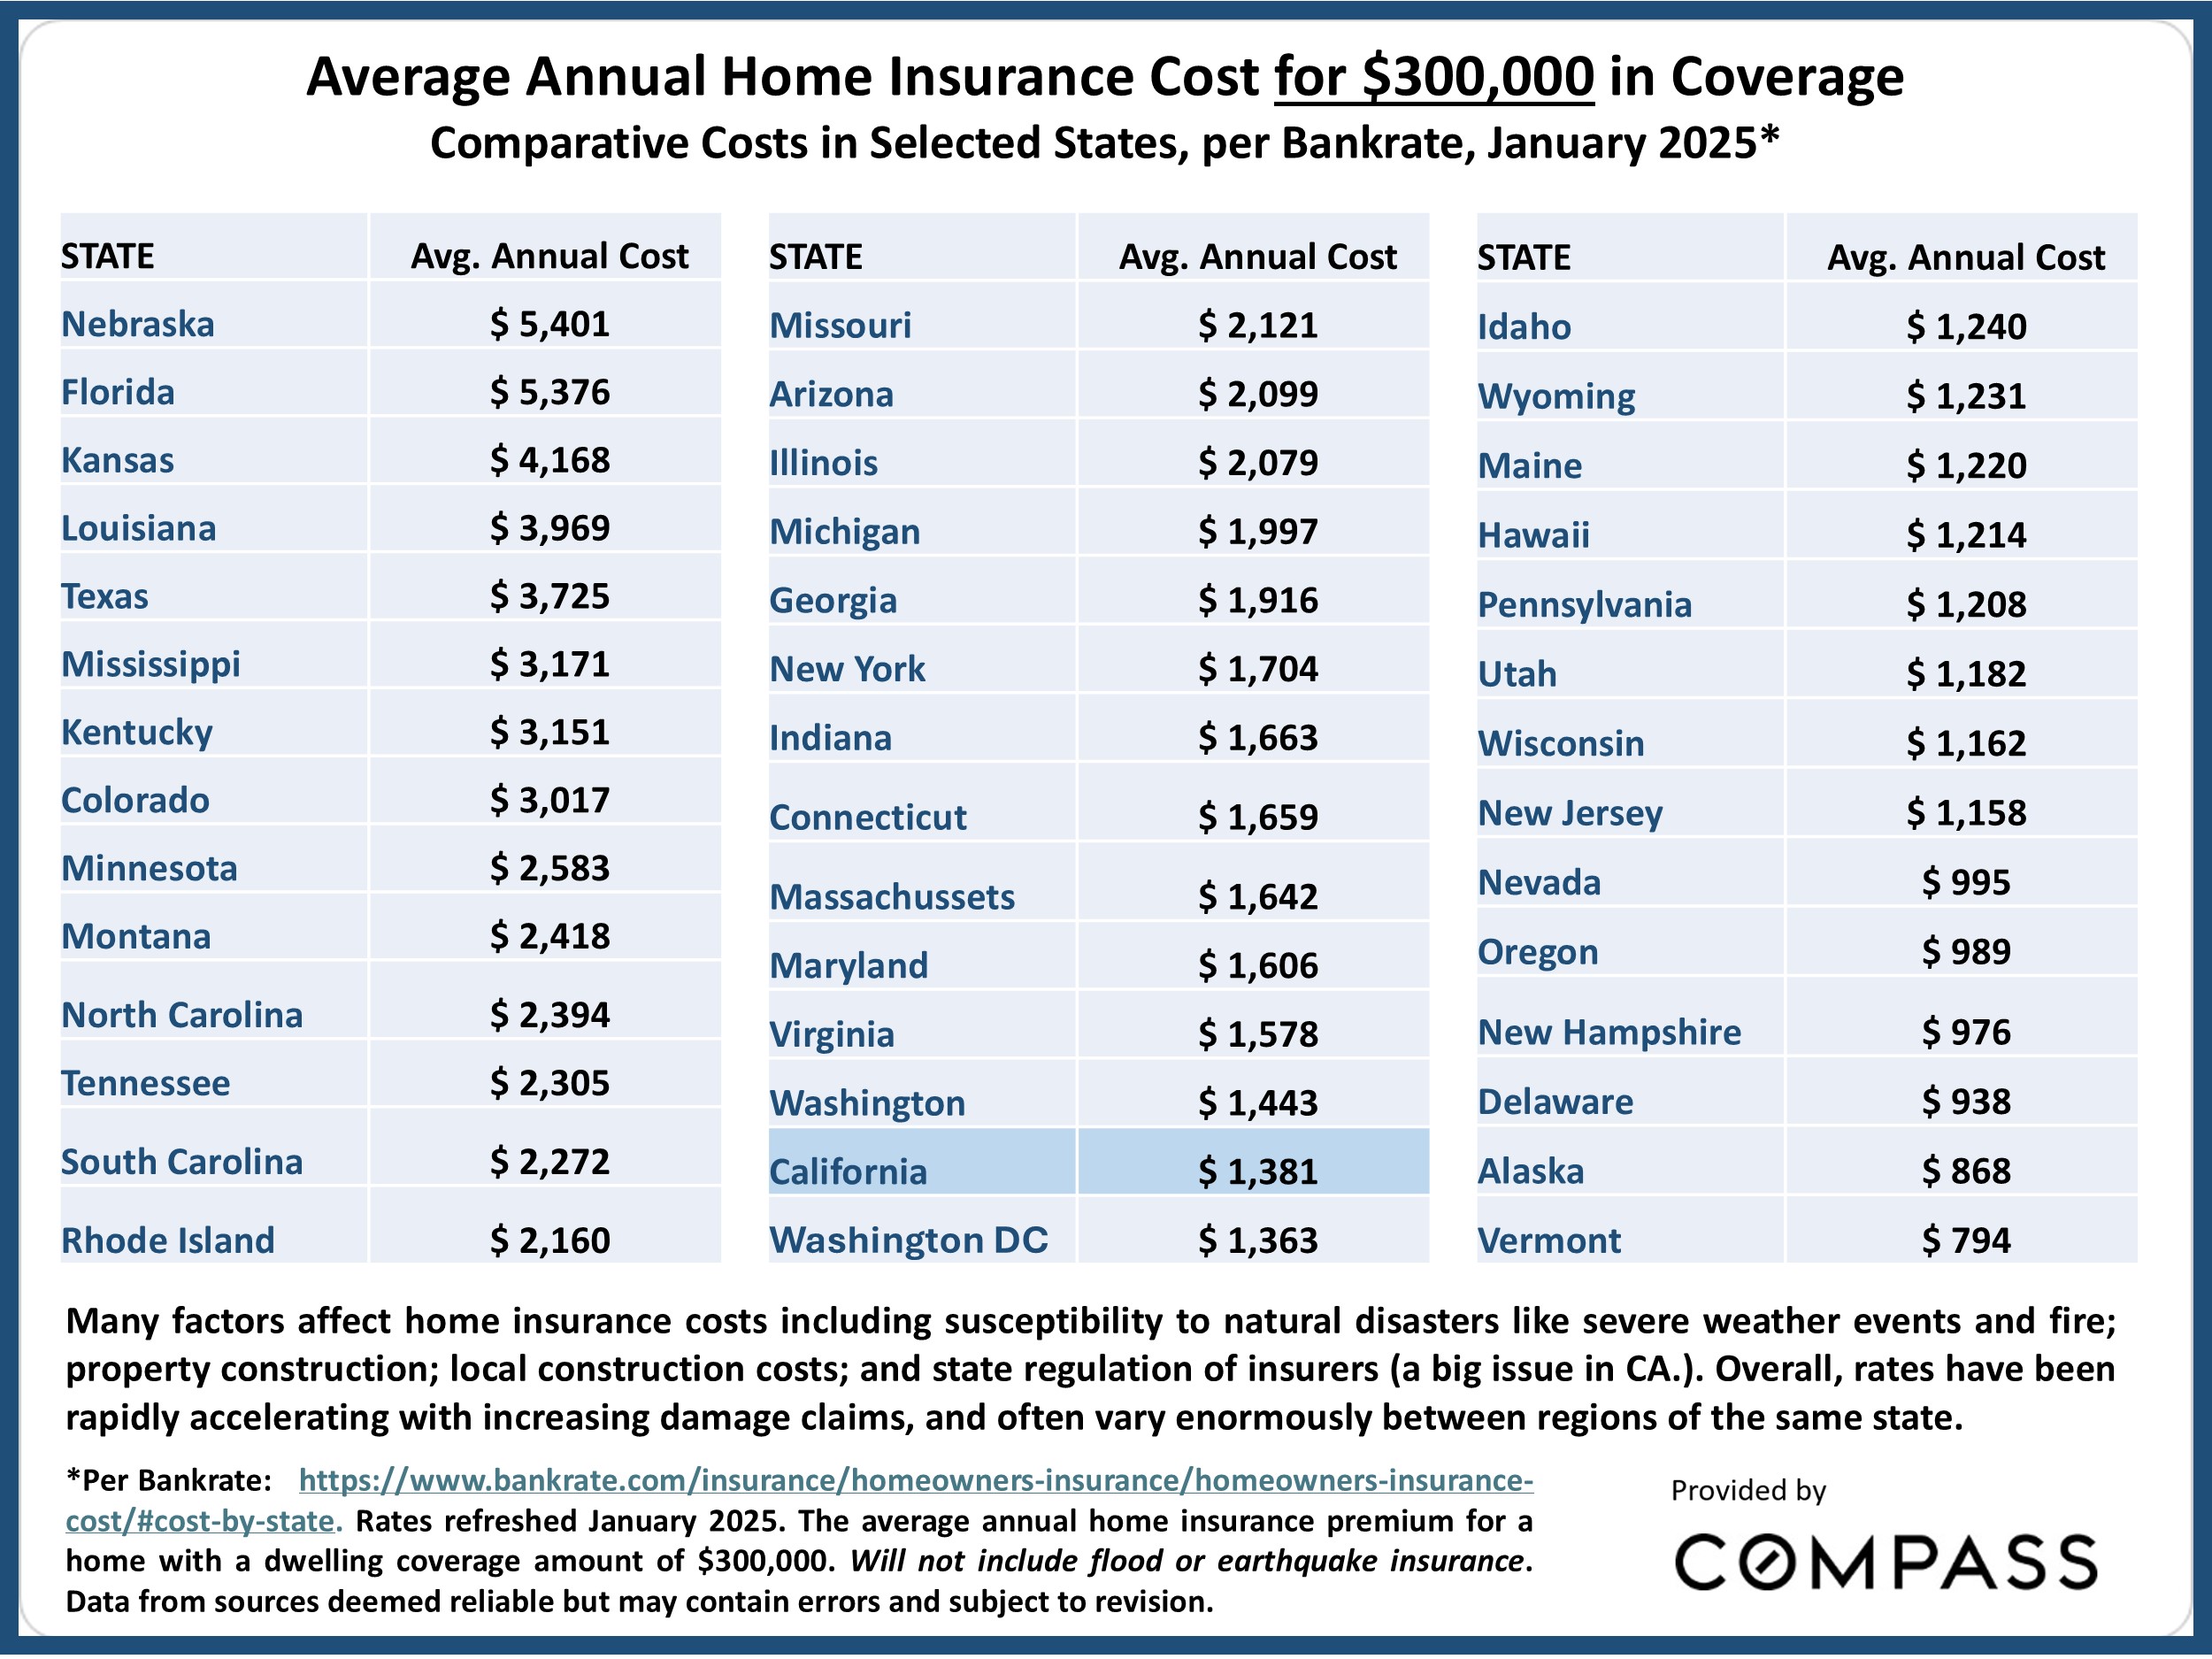
Though climbing rapidly in recent years, analysts believe CA insurance costs have been held down unnaturally low due to state insurance regulations, which are now being rapidly revised to try to stop insurers from completely fleeing the state (and continuing to shift enormous financial liabilities to the state Fair Plan). Needless to say, the horrifying fires in SoCal will only exacerbate the critical situation regarding insurance. The rates in this chart are changing quickly and substantially.